Plotting publicly available COVID data for the state of Ohio.
Most recent data: Mar 26 2025.
Data source
These plots are made using the summary data posted by the state of Ohio for the new case rate, new hospitalization, and new death plots. The most recent week are omitted, as the data is very incomplete. Values for the most recent two weeks may change, and are flagged by a paler tone color in the plots below.
Ohio has transitioned to updating its dashboards once a week, on Thursdays. Data can only be posted on Thursdays as a result.
The Ohio Department of Health is no longer reporting daily case rates.
7 day averages
The 7 day averages for the wastewater estimated daily increase in cases. If no new cases were reported, these lines would go to zero.
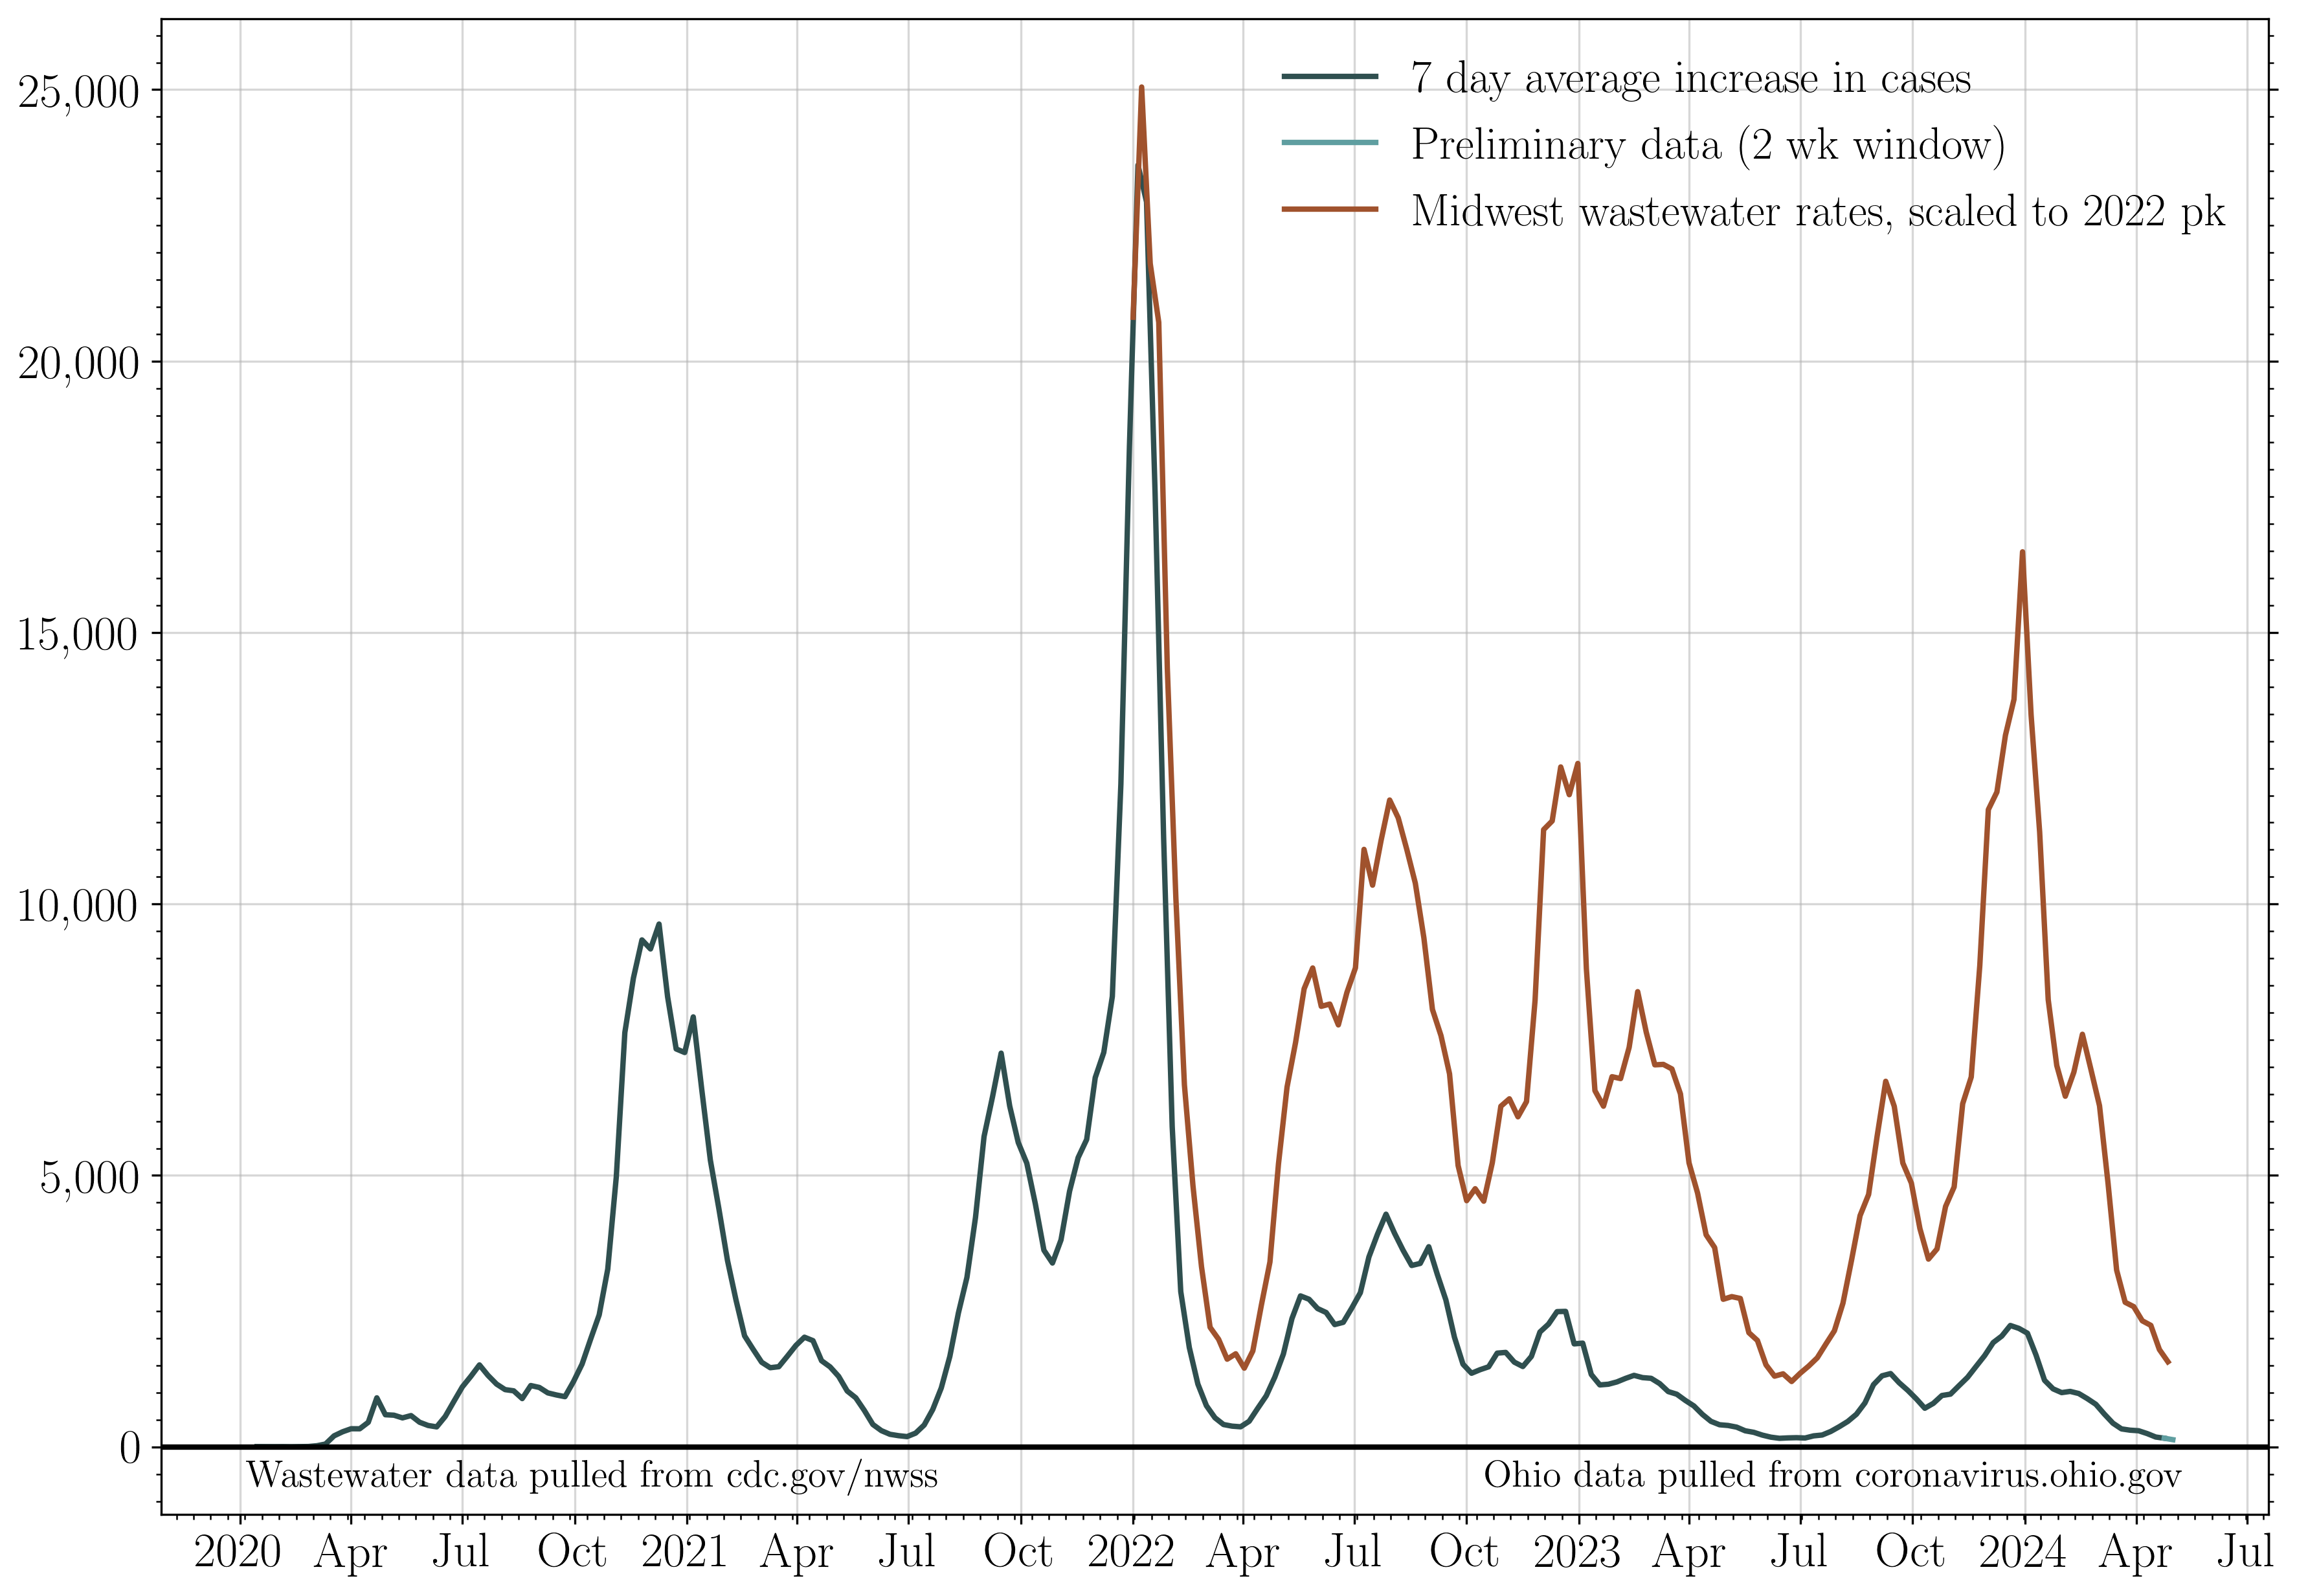
The average increase in wastewater estimated cases for the seven days ending on Mar 26 is: 3824.0
The last time wastewater estimated cases per day were this high was Mar 22 2025: 7 days prior.
The seven day average then was: 3945 cases.
The last time wastewater estimated cases per day was lower than this was Nov 30 2024: 119 days prior.
The seven day average then was: 3499 cases.
Mar 26 marks the lowest 7 day average in the last three weeks.
The 7 day averages for the daily increase in hospitalizations and deaths. If no new events were reported, these lines would go to zero.
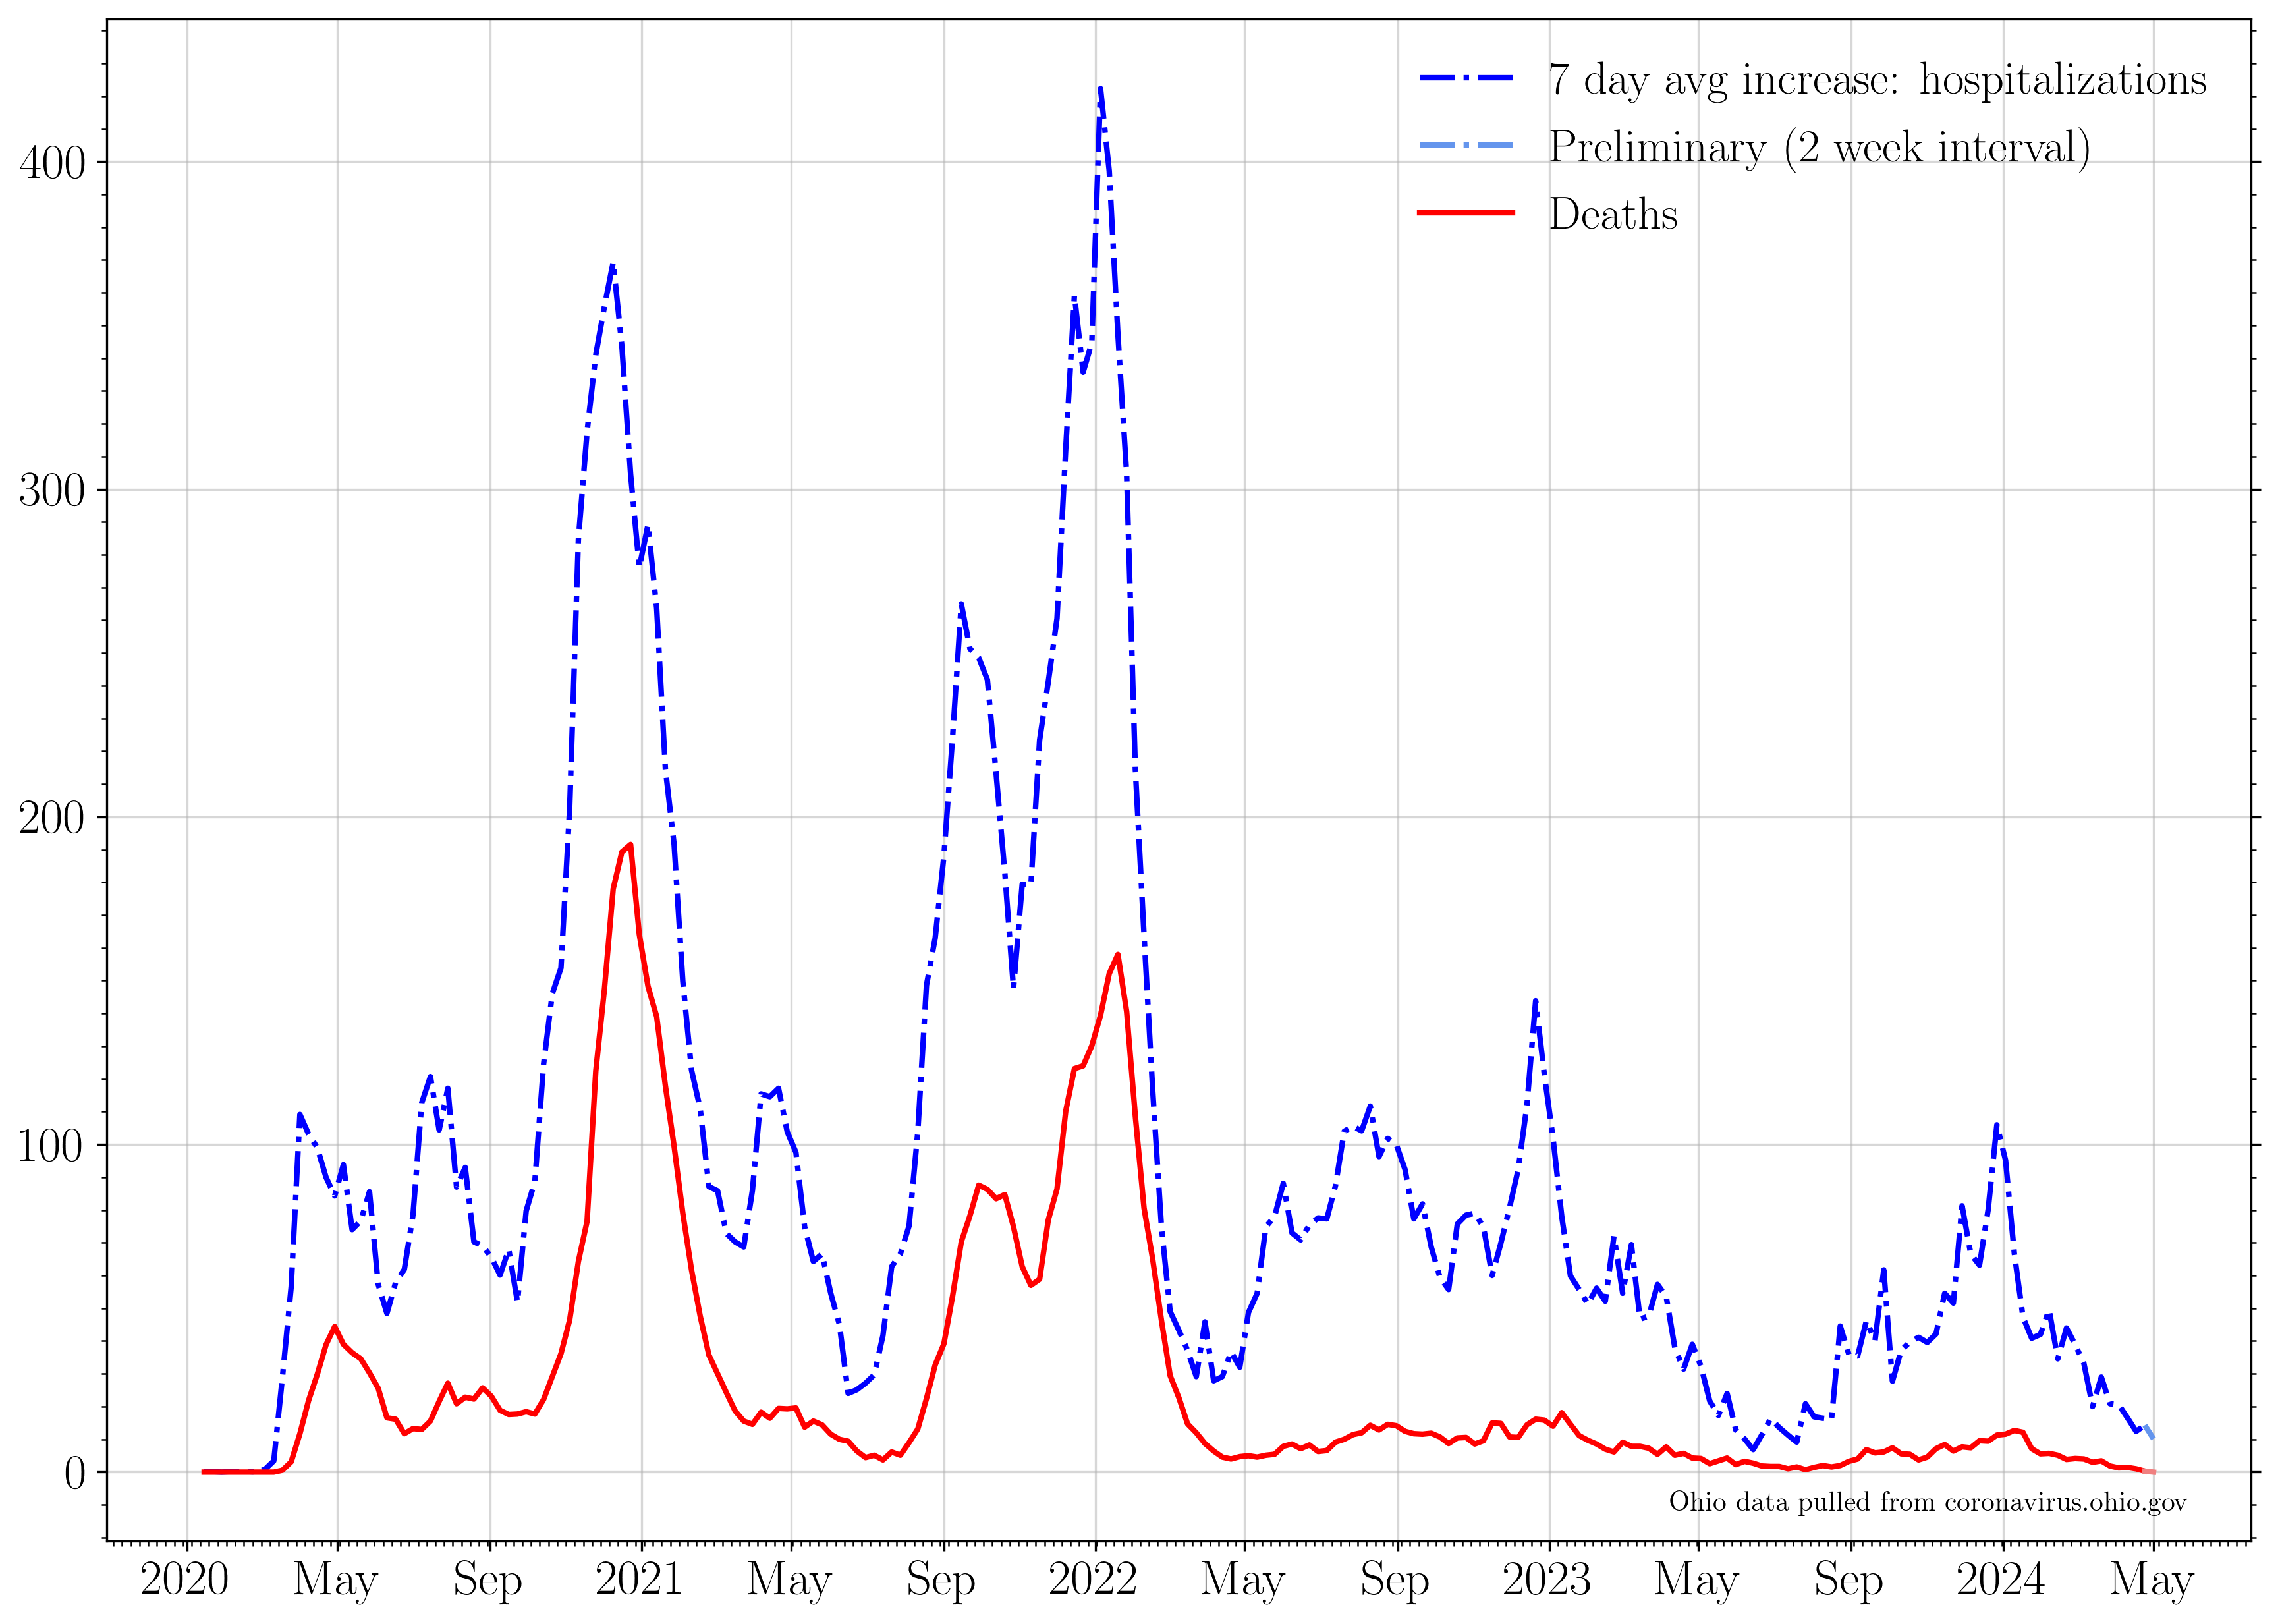
The average increase in hospitalizations per day for the seven days ending on Mar 26 is: 23
Mar 26 marks the lowest 7 day average in hospitalizations in the last three weeks.
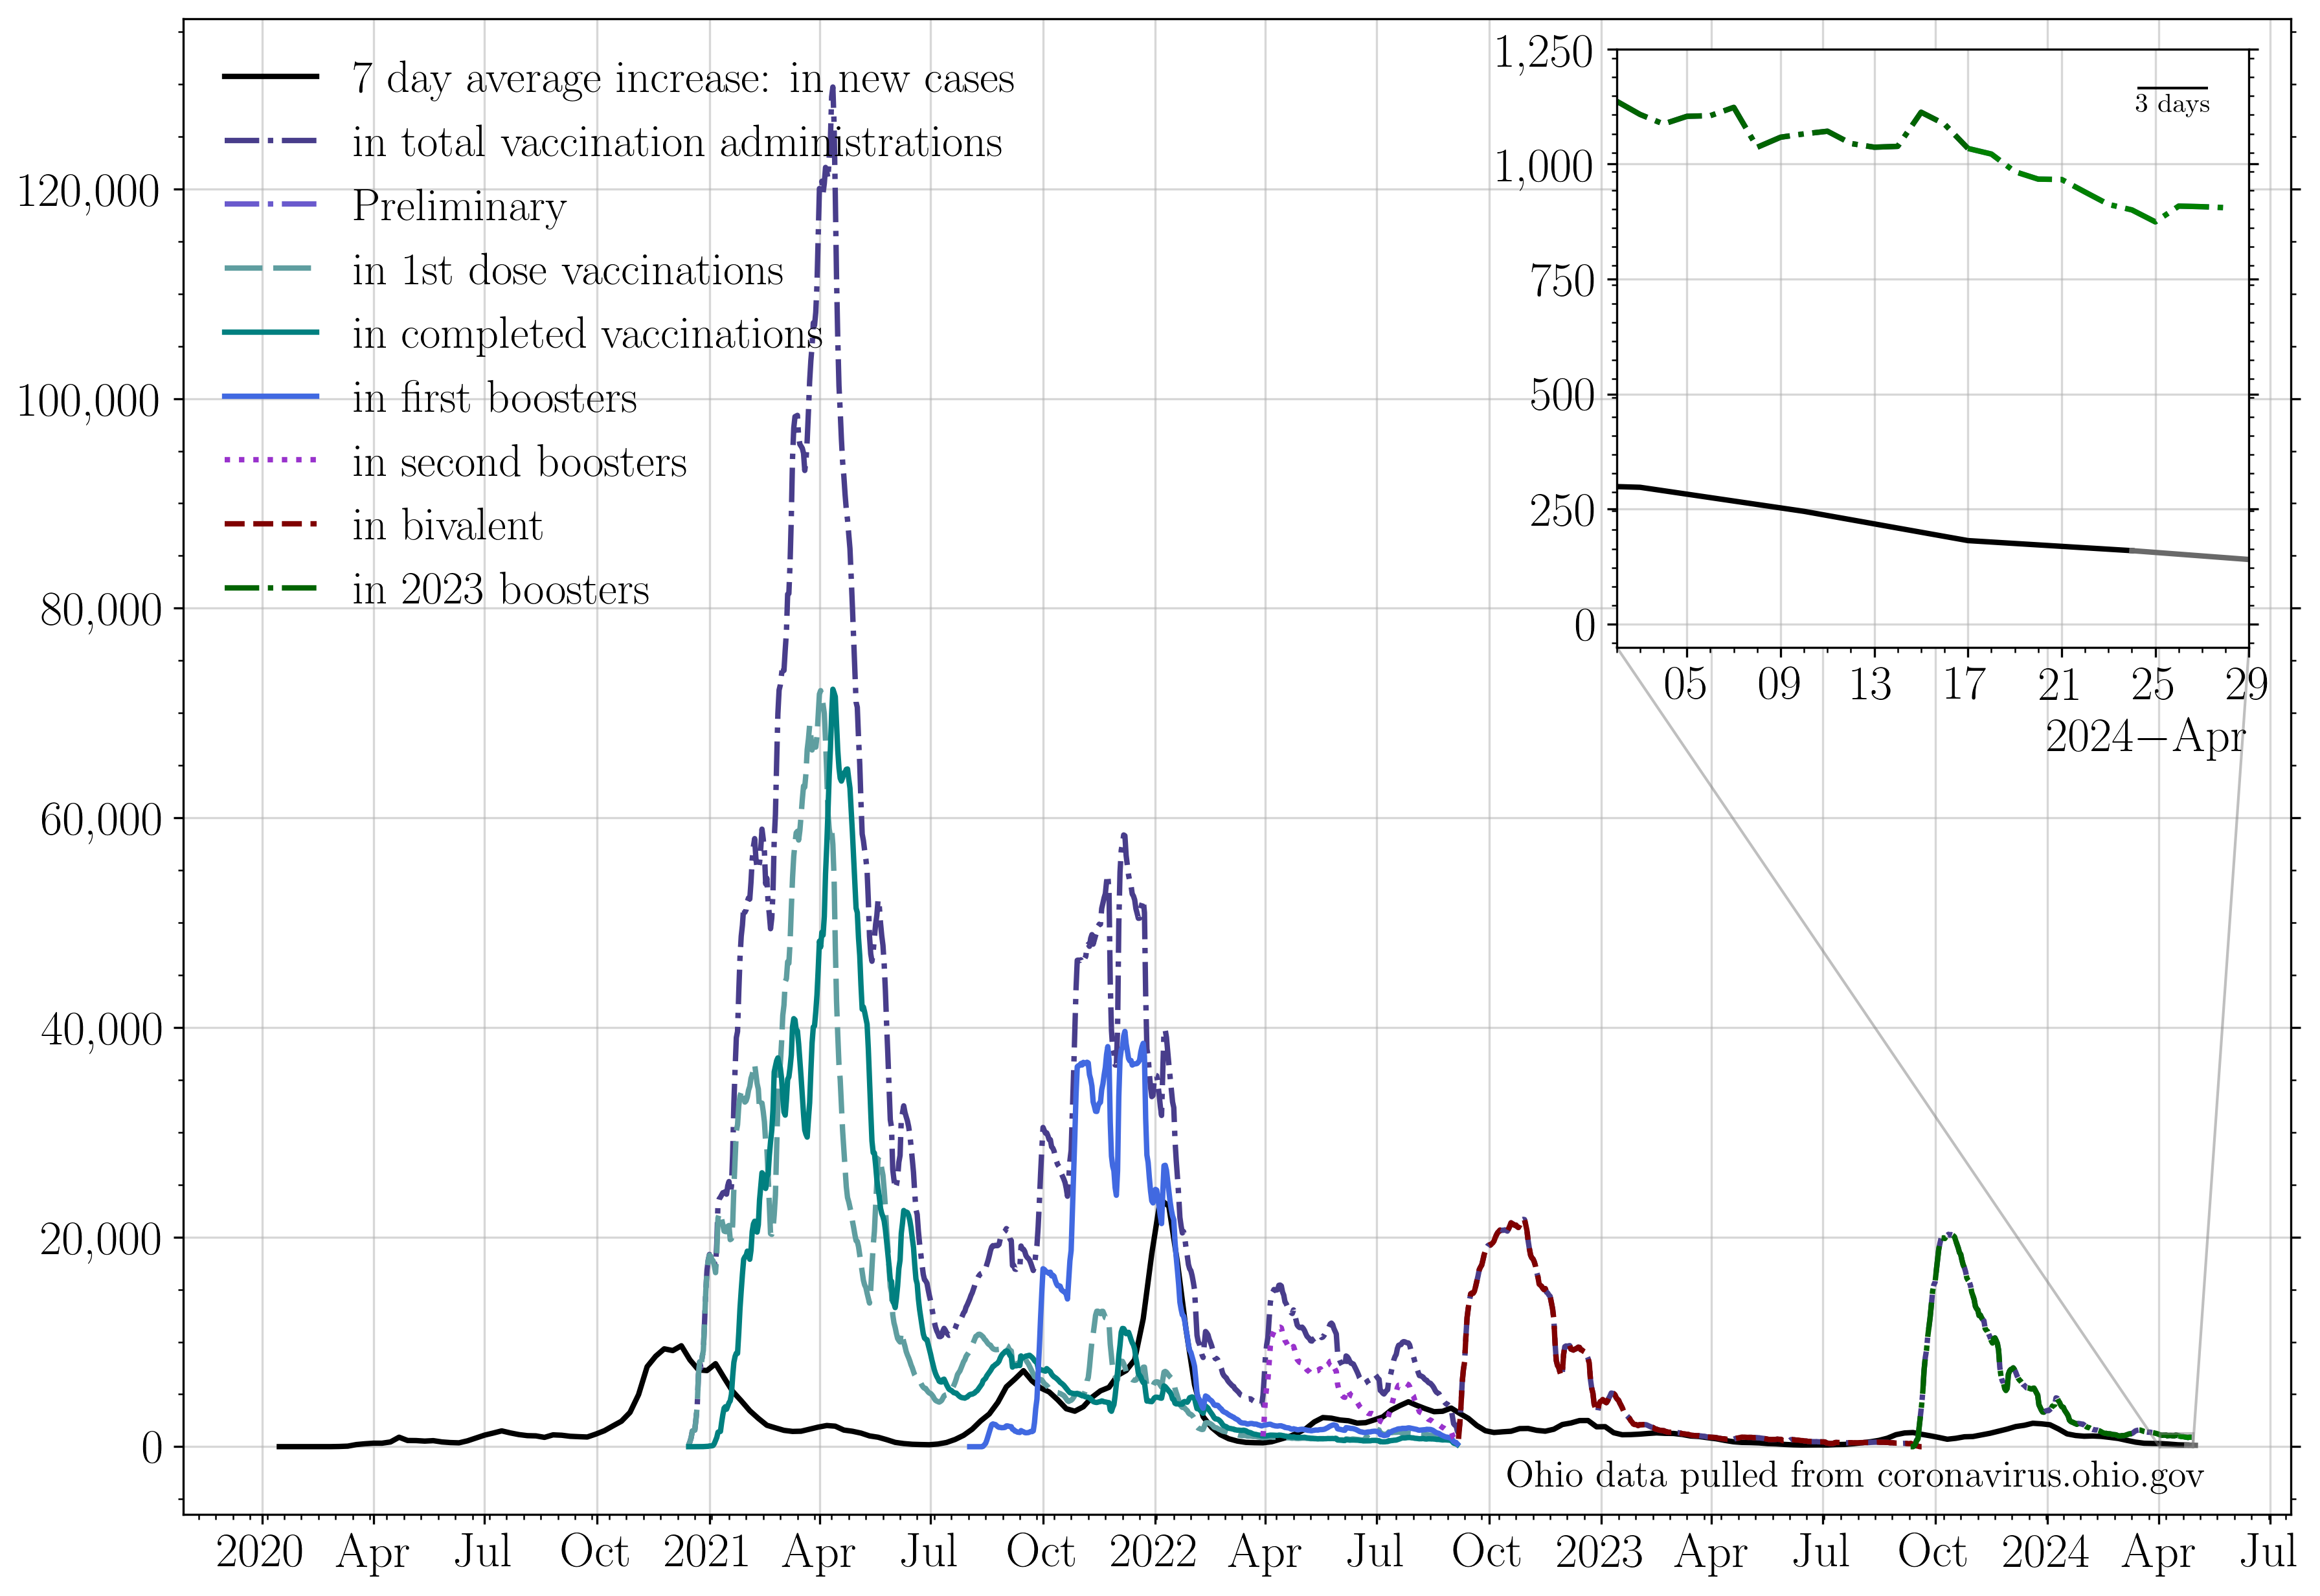
The 7 day average increase in cases, compared to the rate of first round vaccinations, second round vaccinations, and total number of vaccinations dispensed:
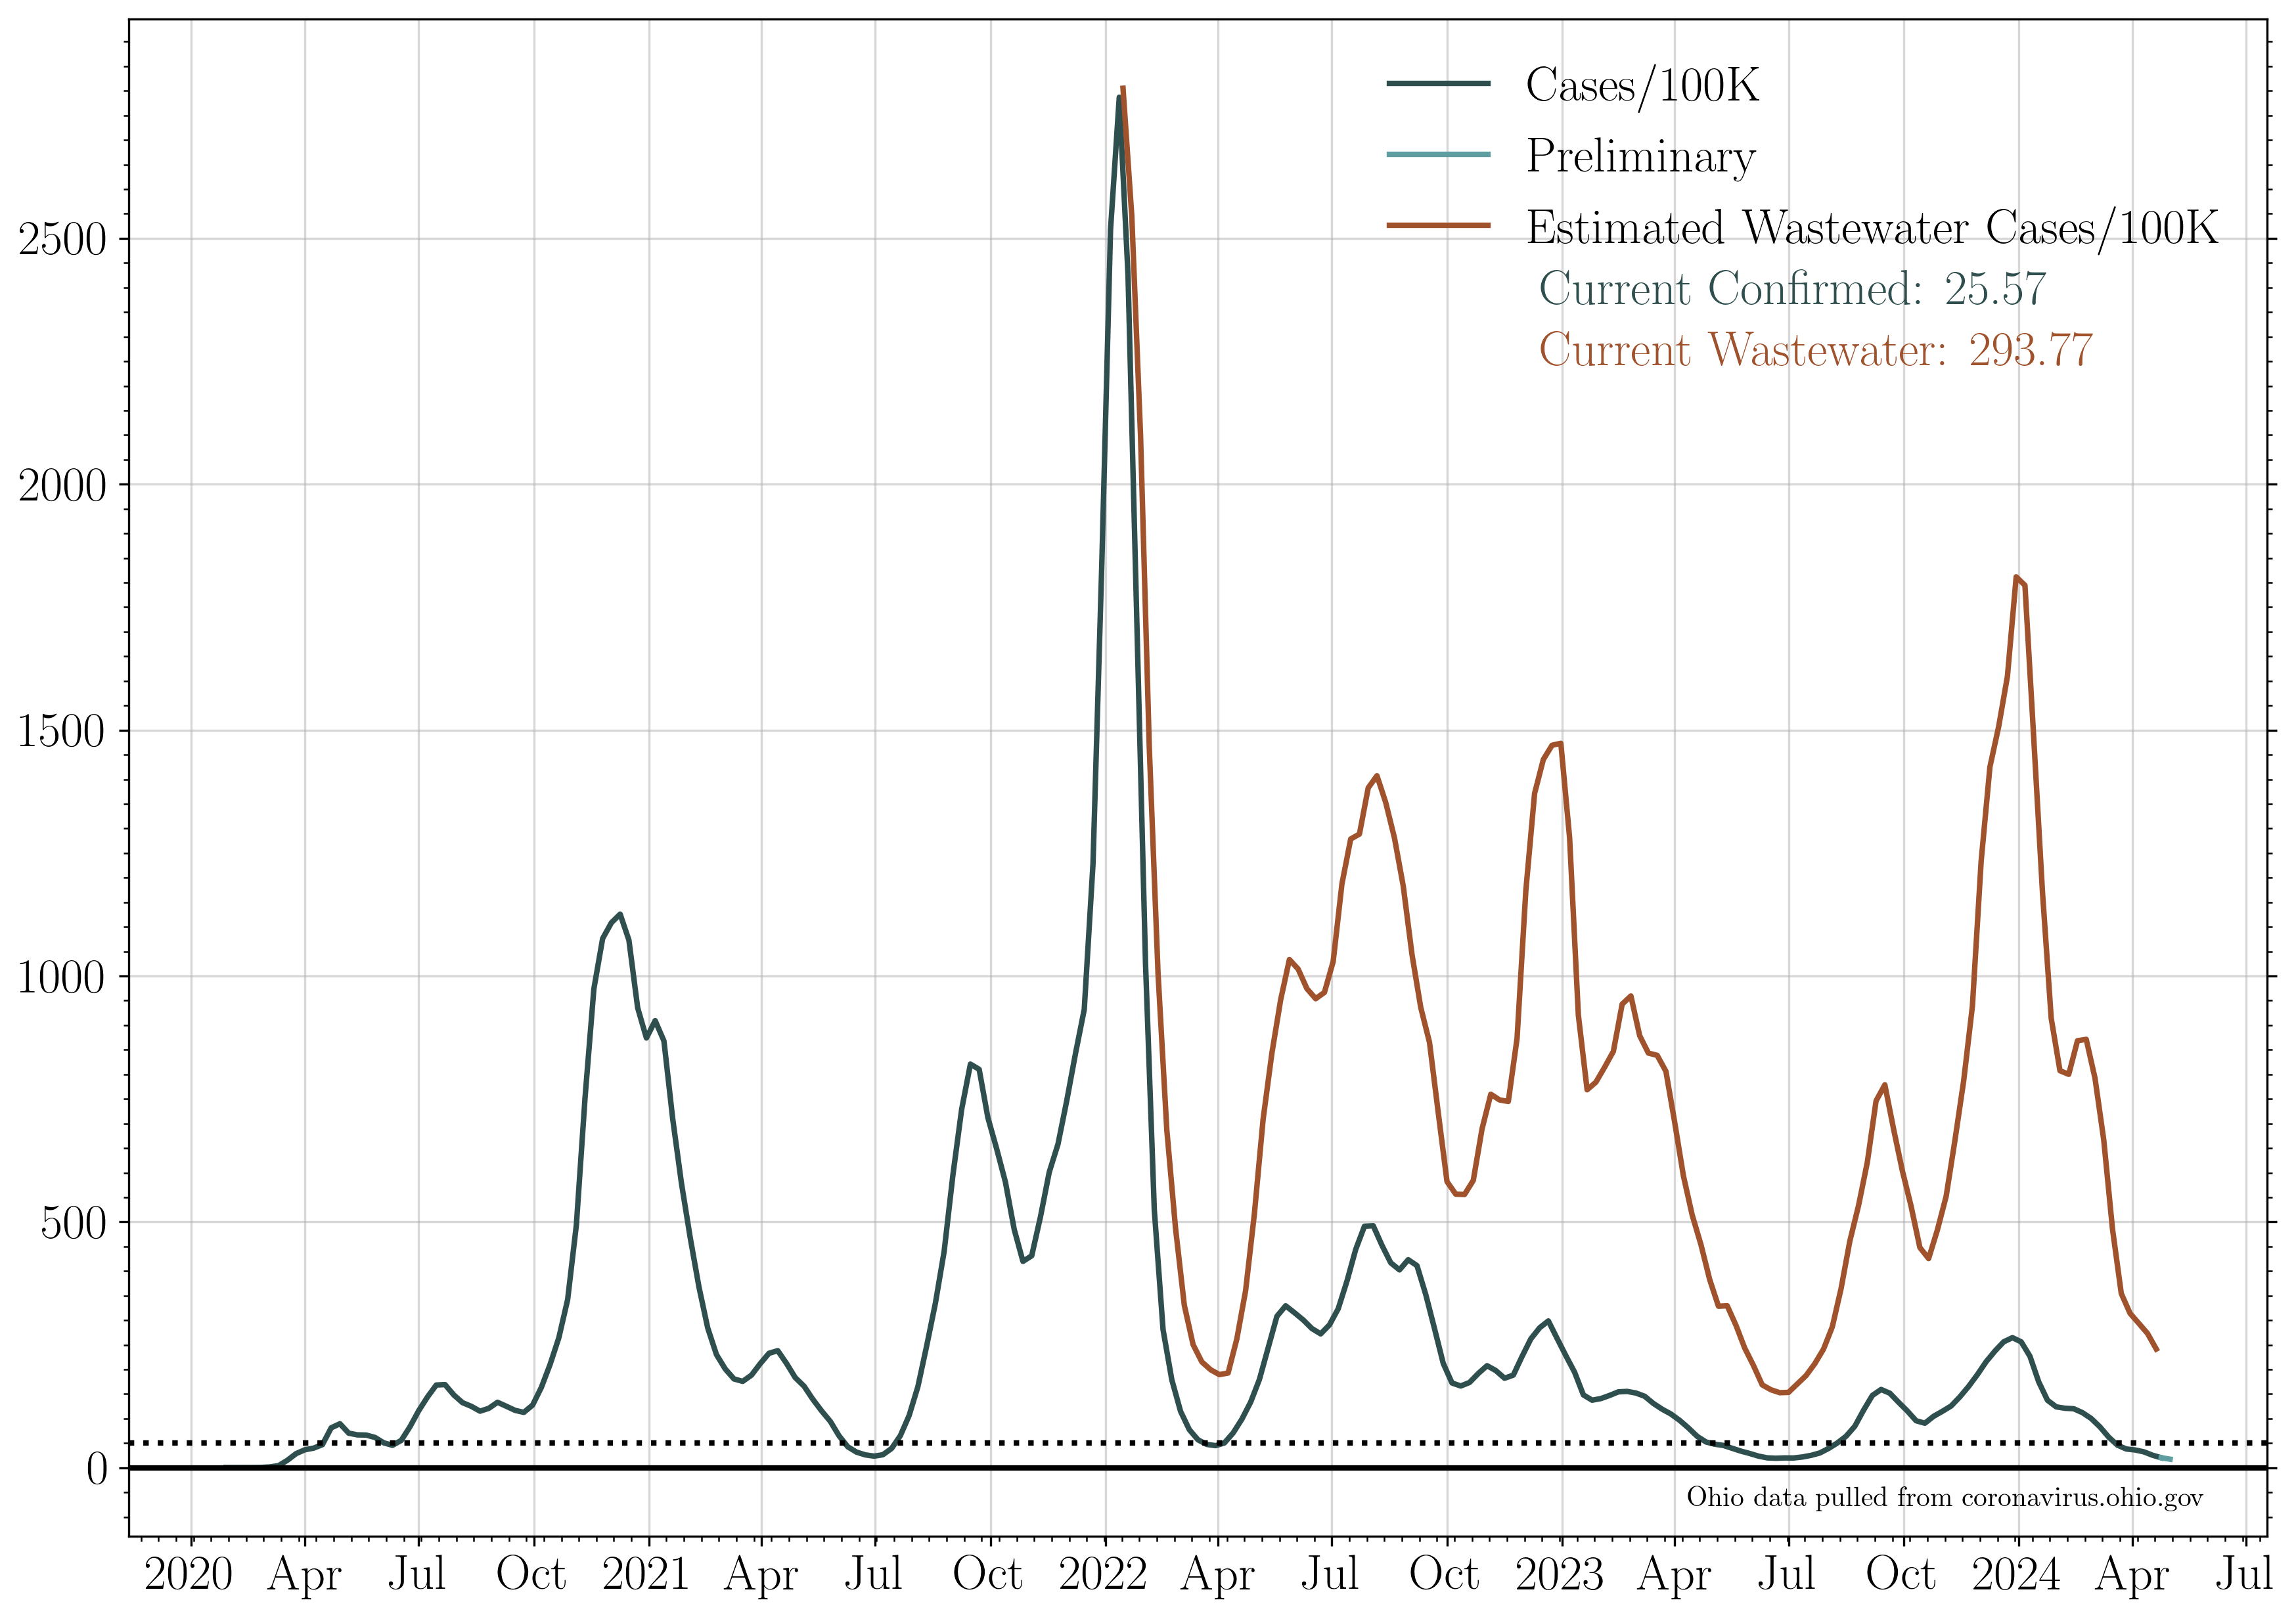
Case rates/100K
The number of positive cases per 100,000 people in the state of Ohio (gray). This is an estimate based on the number of cases reported with onsets within the last two weeks, per 100K people.
Cumulative plots
The cumulative number of cases, hospitalizations, ICU admissions, and deaths. If no new cases were reported, these lines would be horizontal.
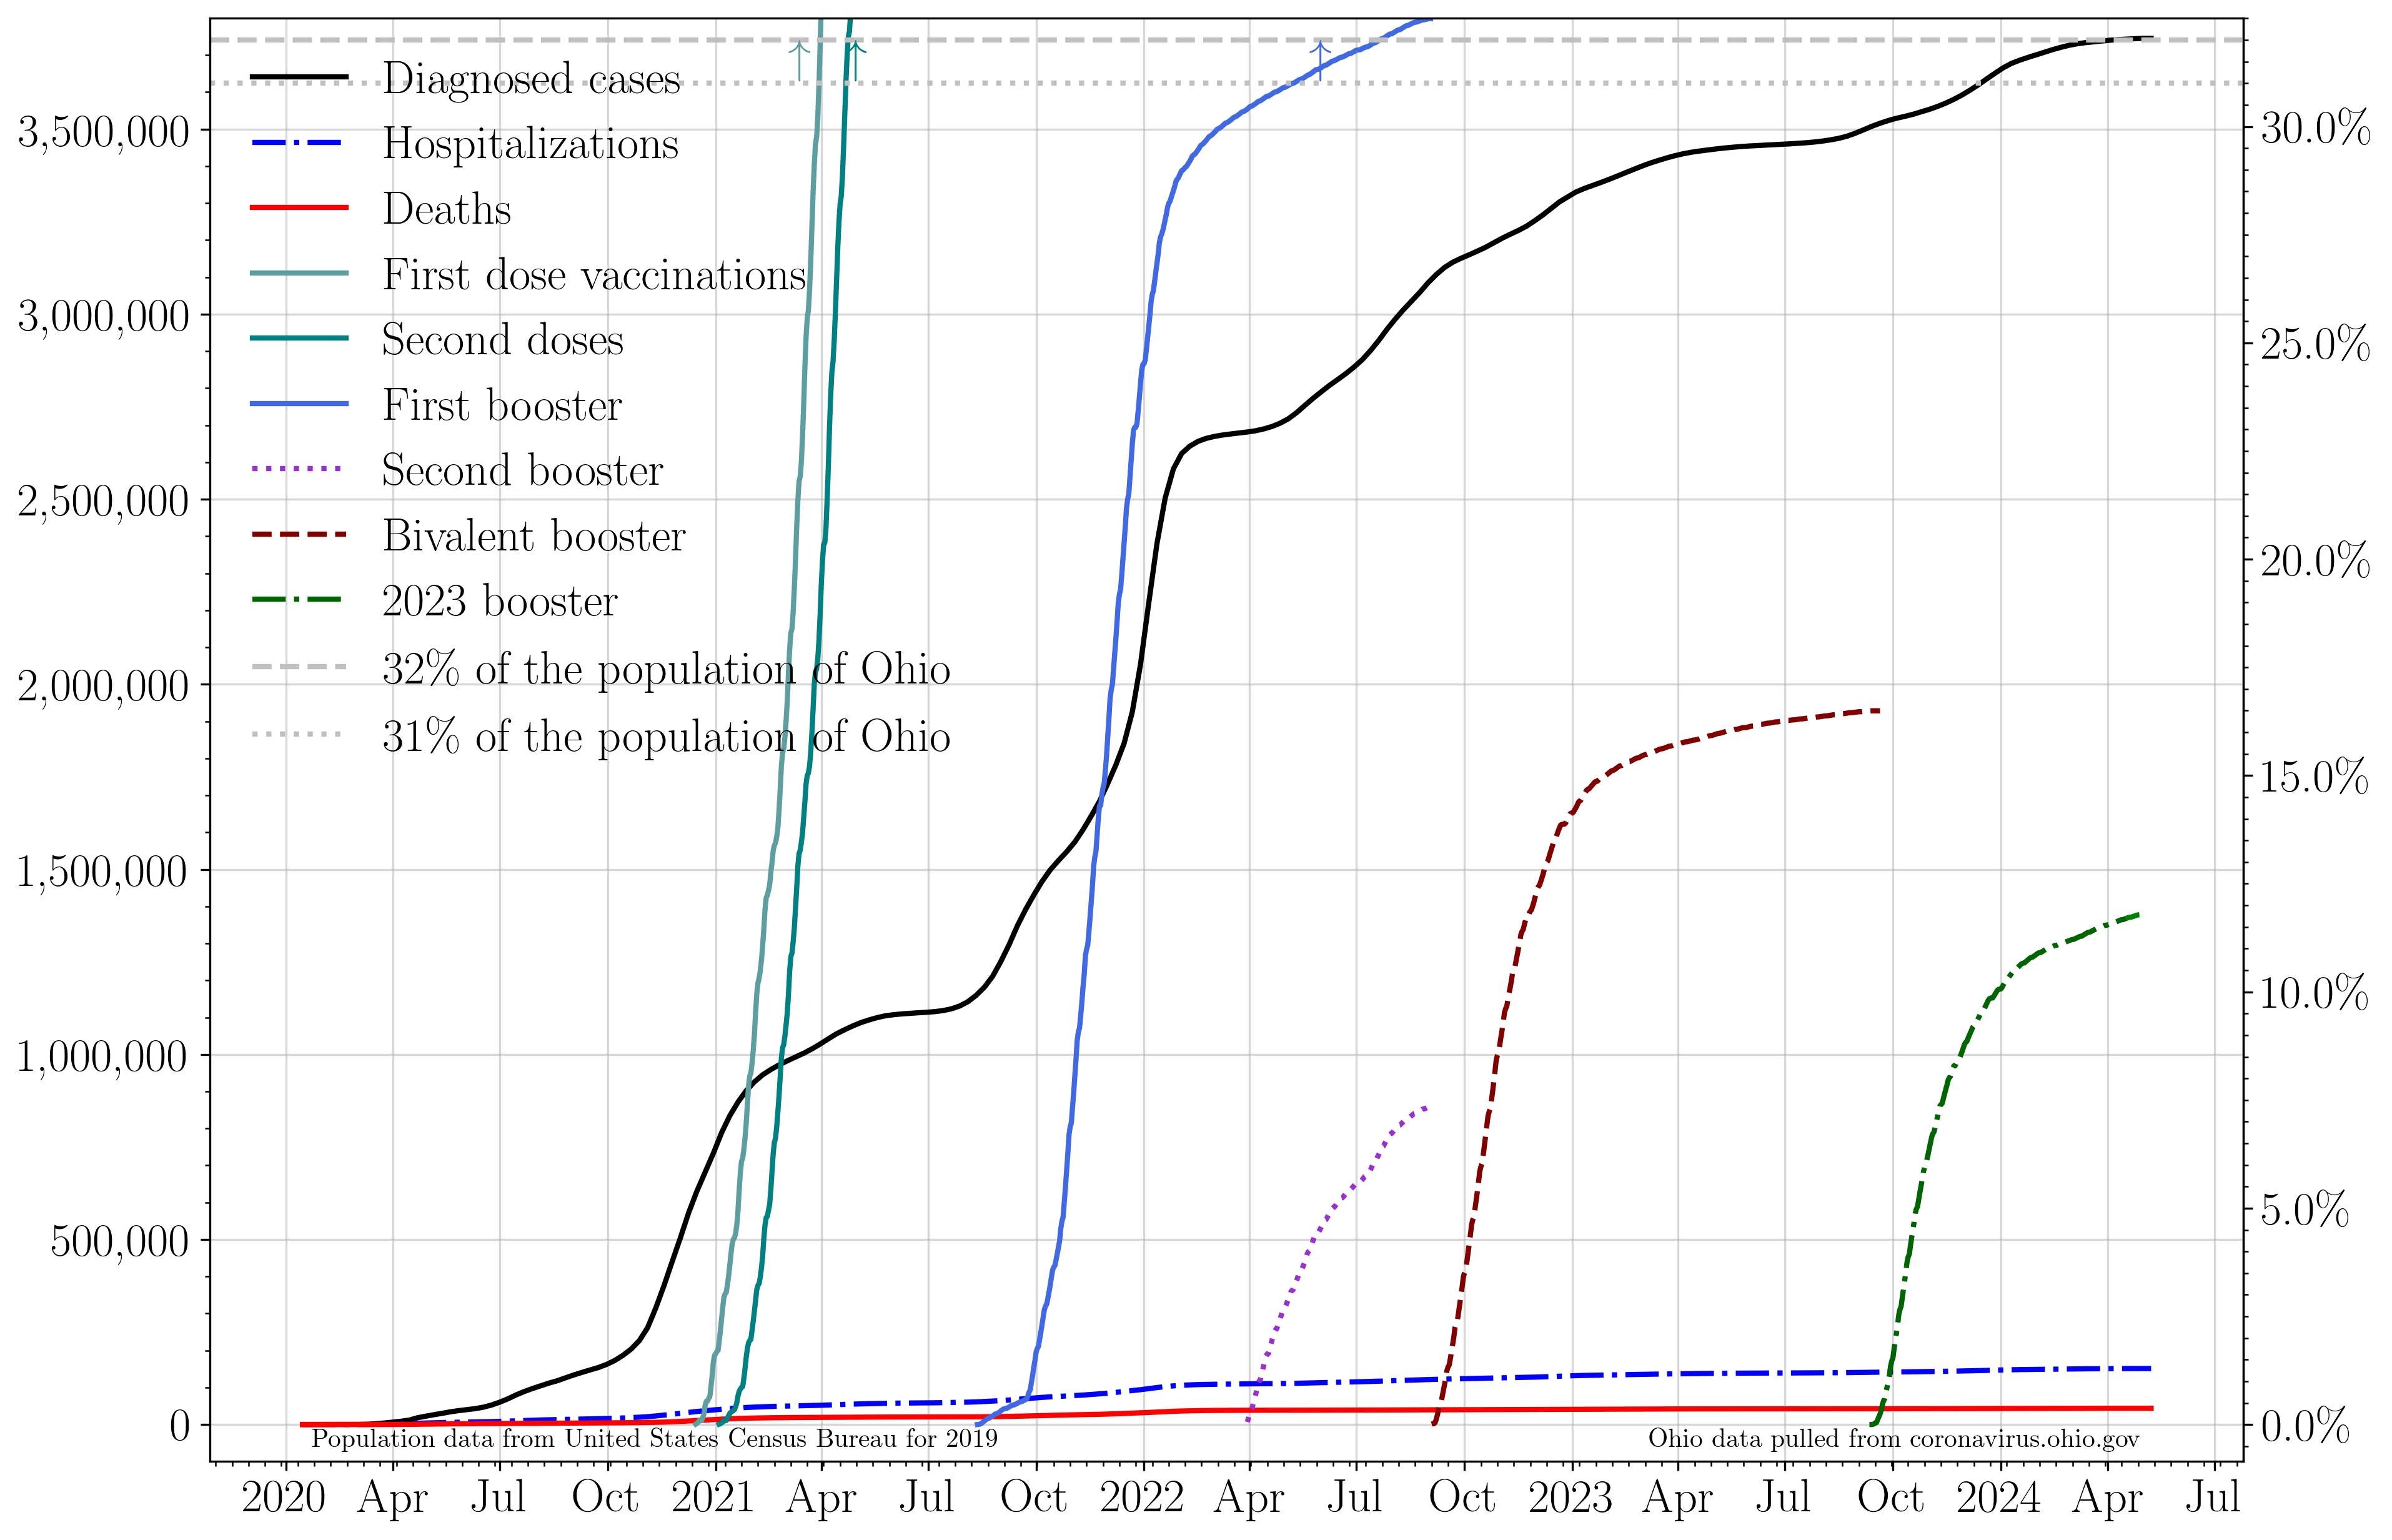
The current total number of cases is equivalent to 1 person out of every 3 people in the state of Ohio having tested positive for COVID-19.
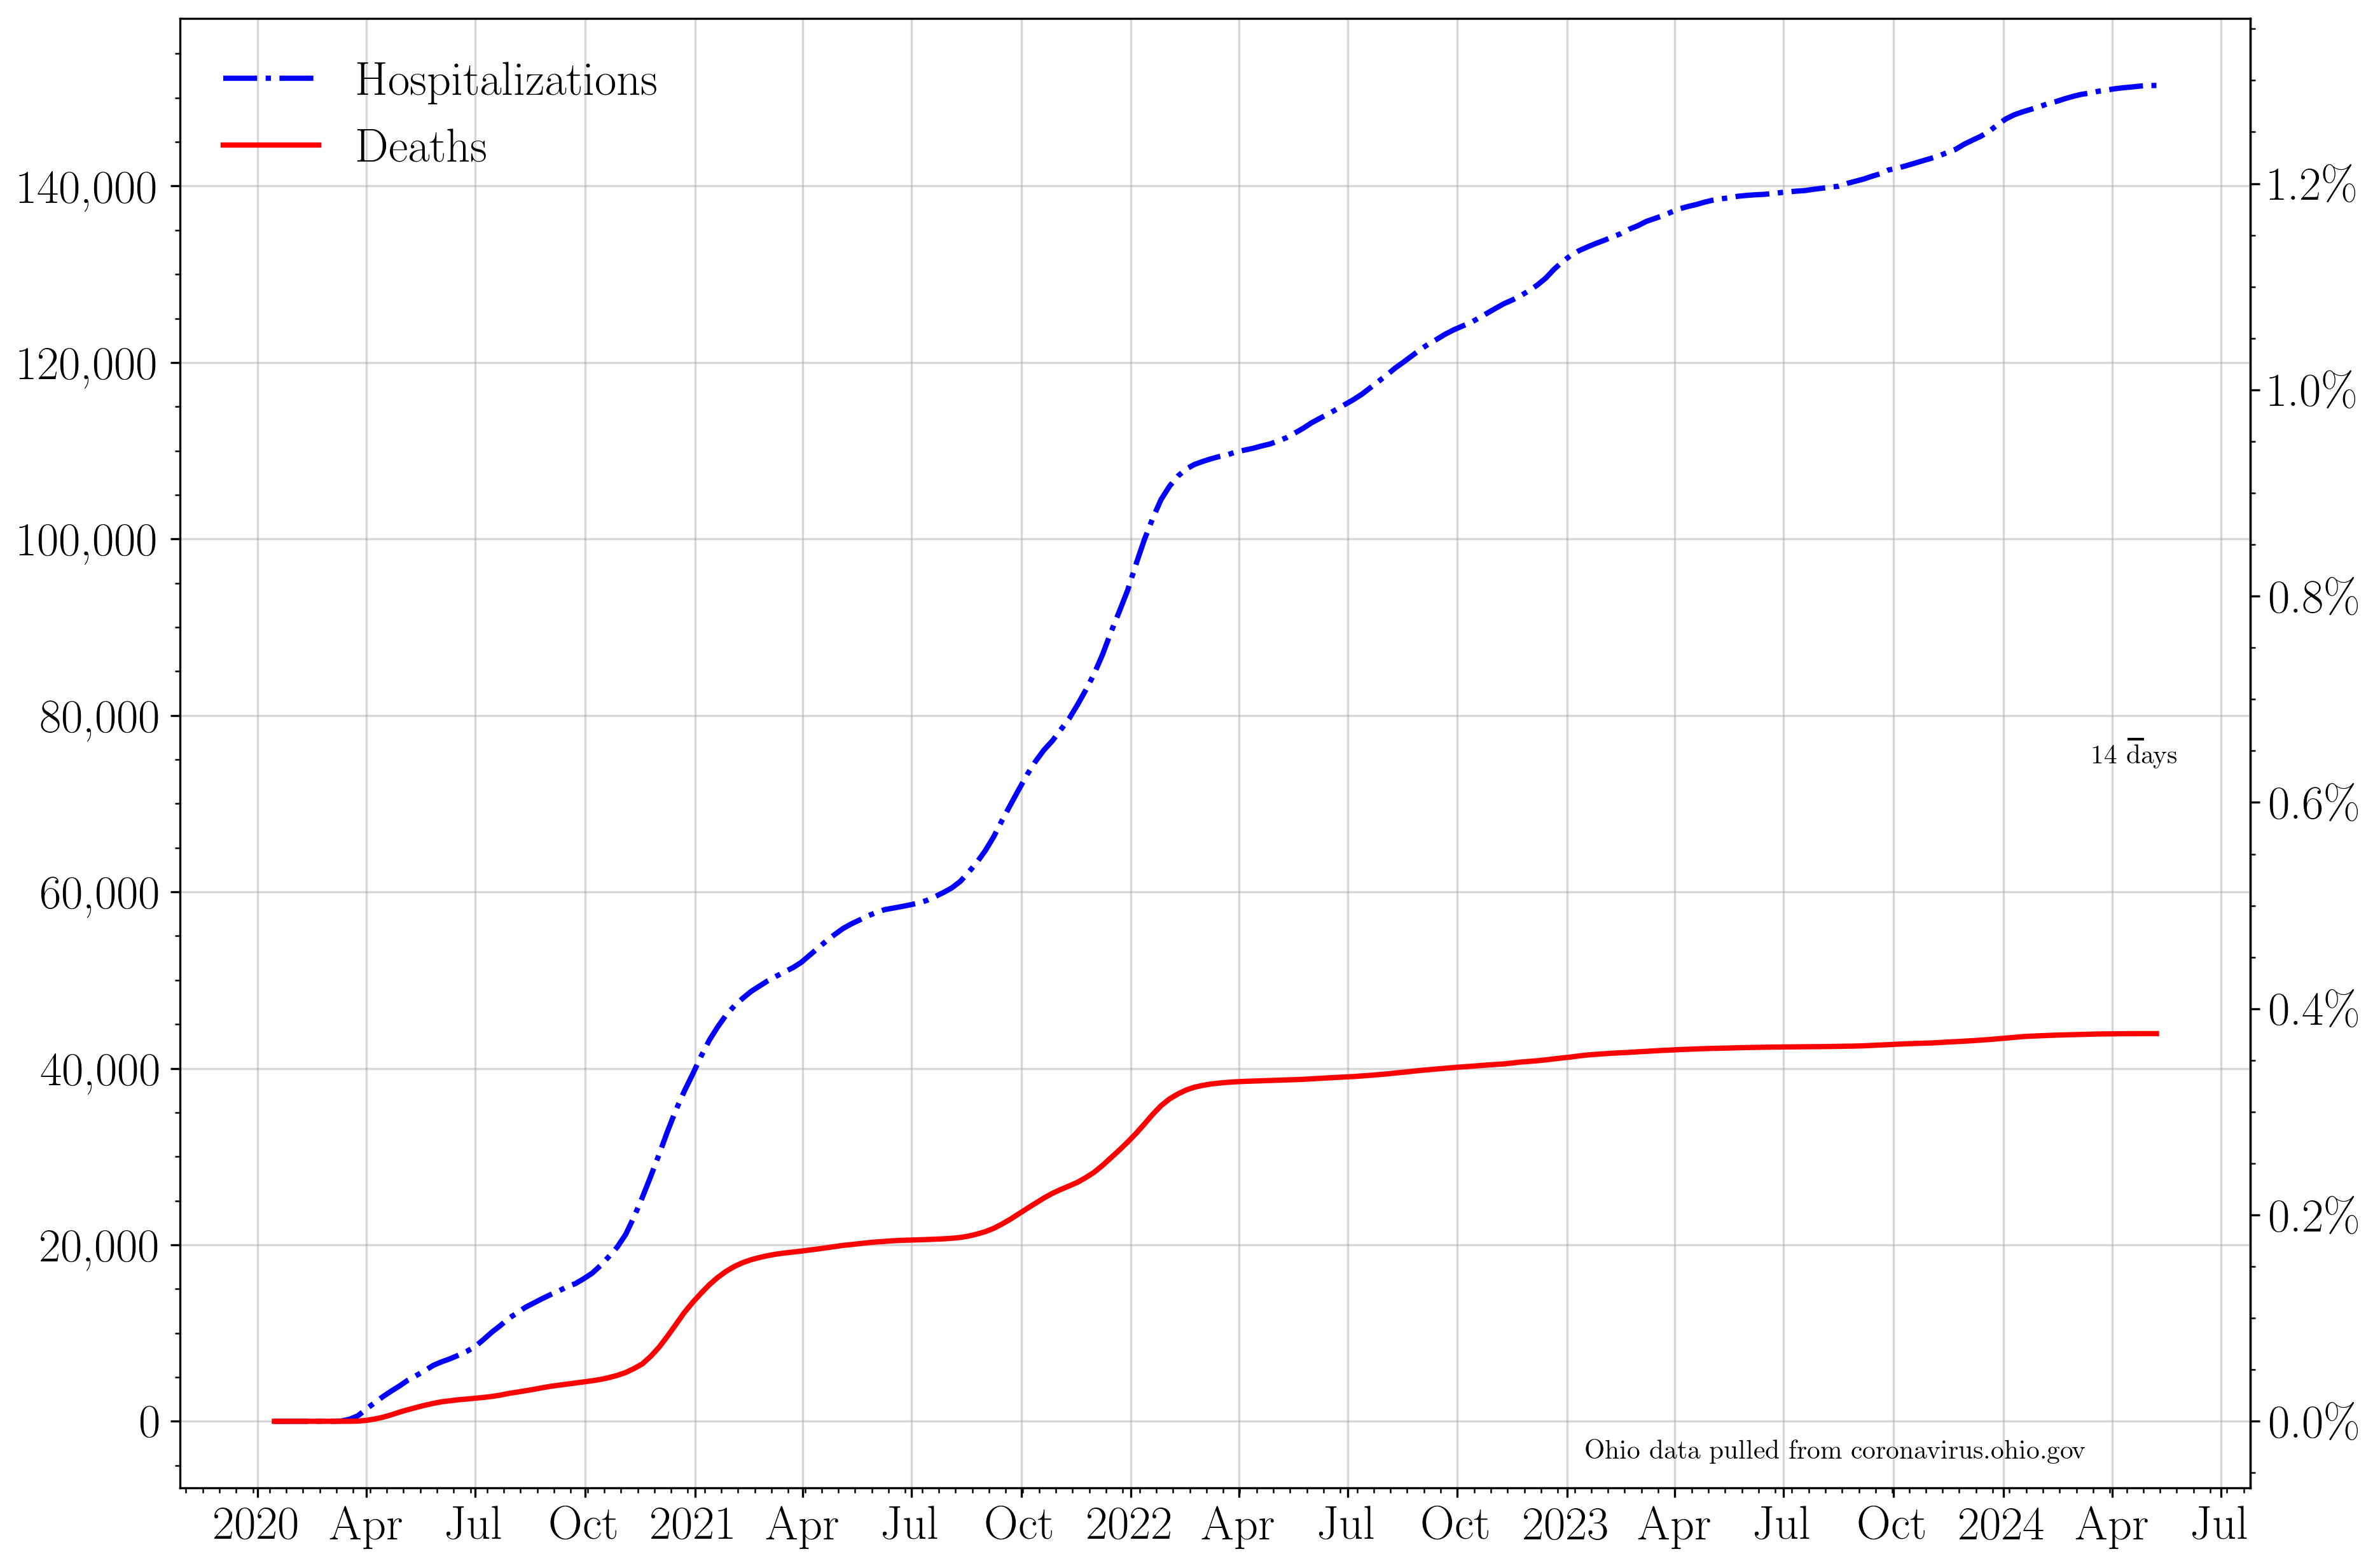
The cumulative number of hospitalizations, ICU admissions, and deaths. If no new events were reported, these lines would be horizontal.
 The cumulative number of first and second round vaccinations. If no new events were reported, these lines would be horizontal.
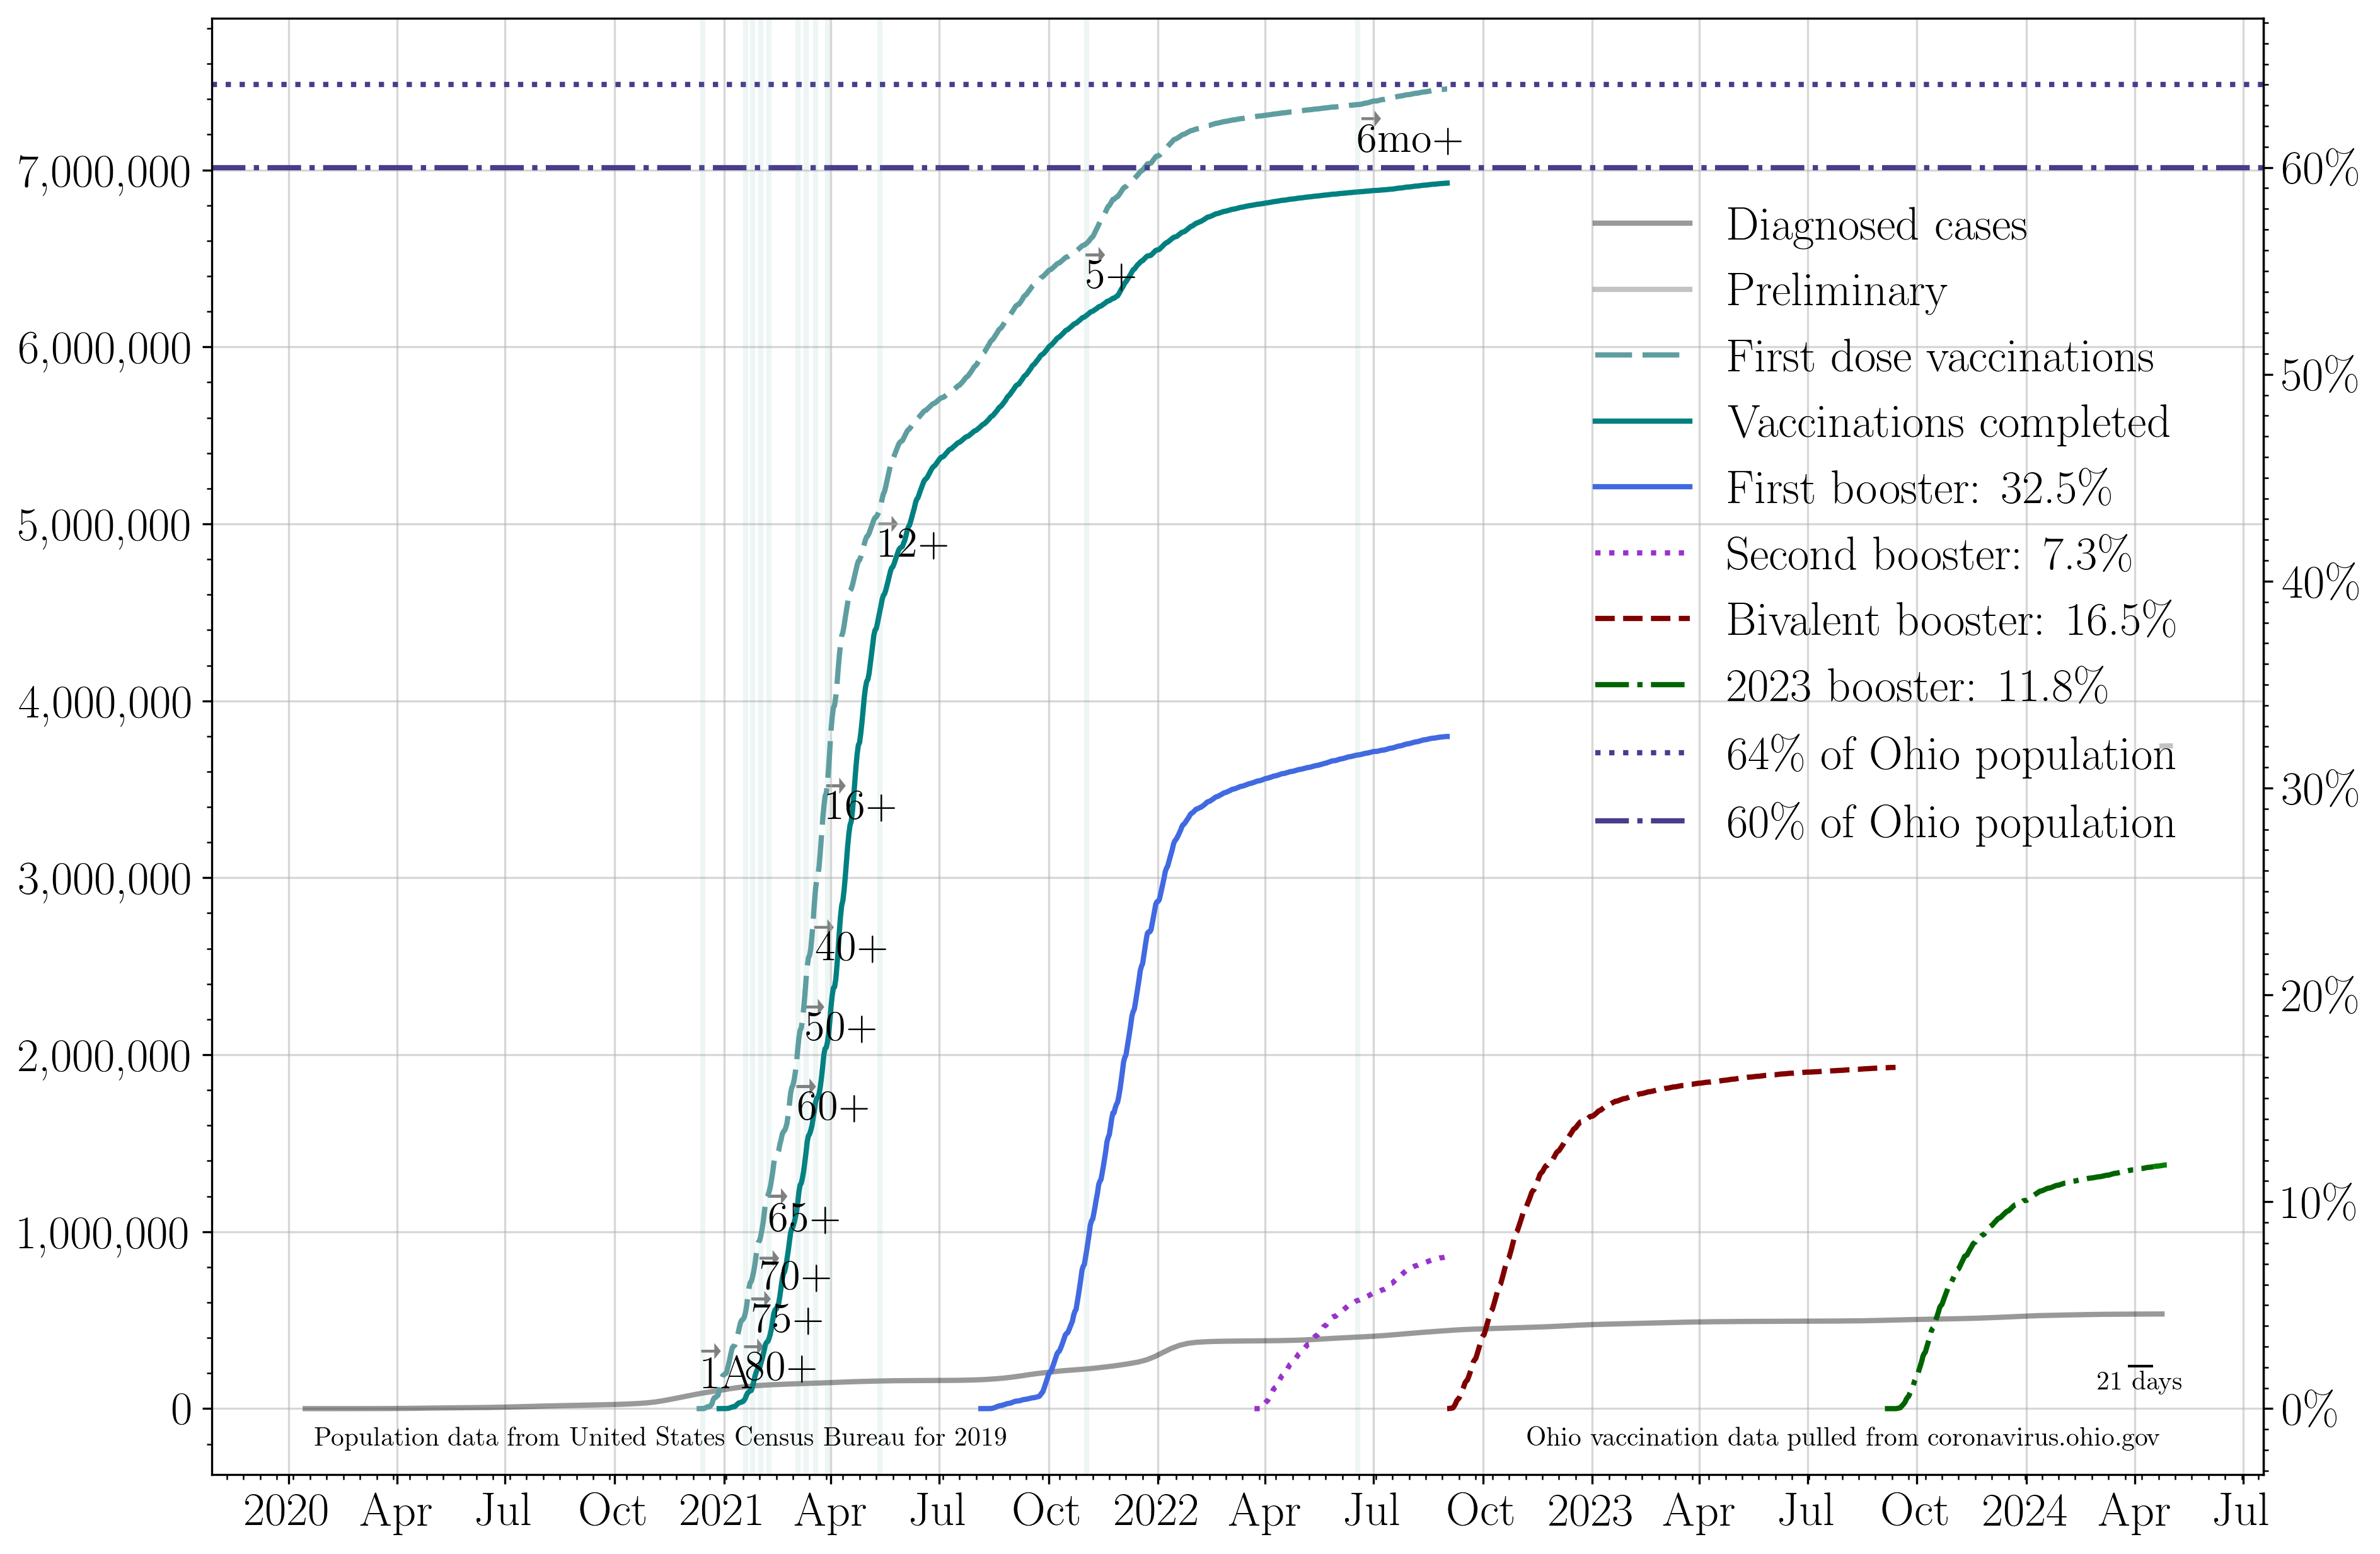
Currently most protected from current variants by 2024 boosters are: 1,261,911 people, who received their 2023 booster dose on or before Mar 26 2025. This represents 10.79 percent of the population of Ohio.
Archival: Raw Data
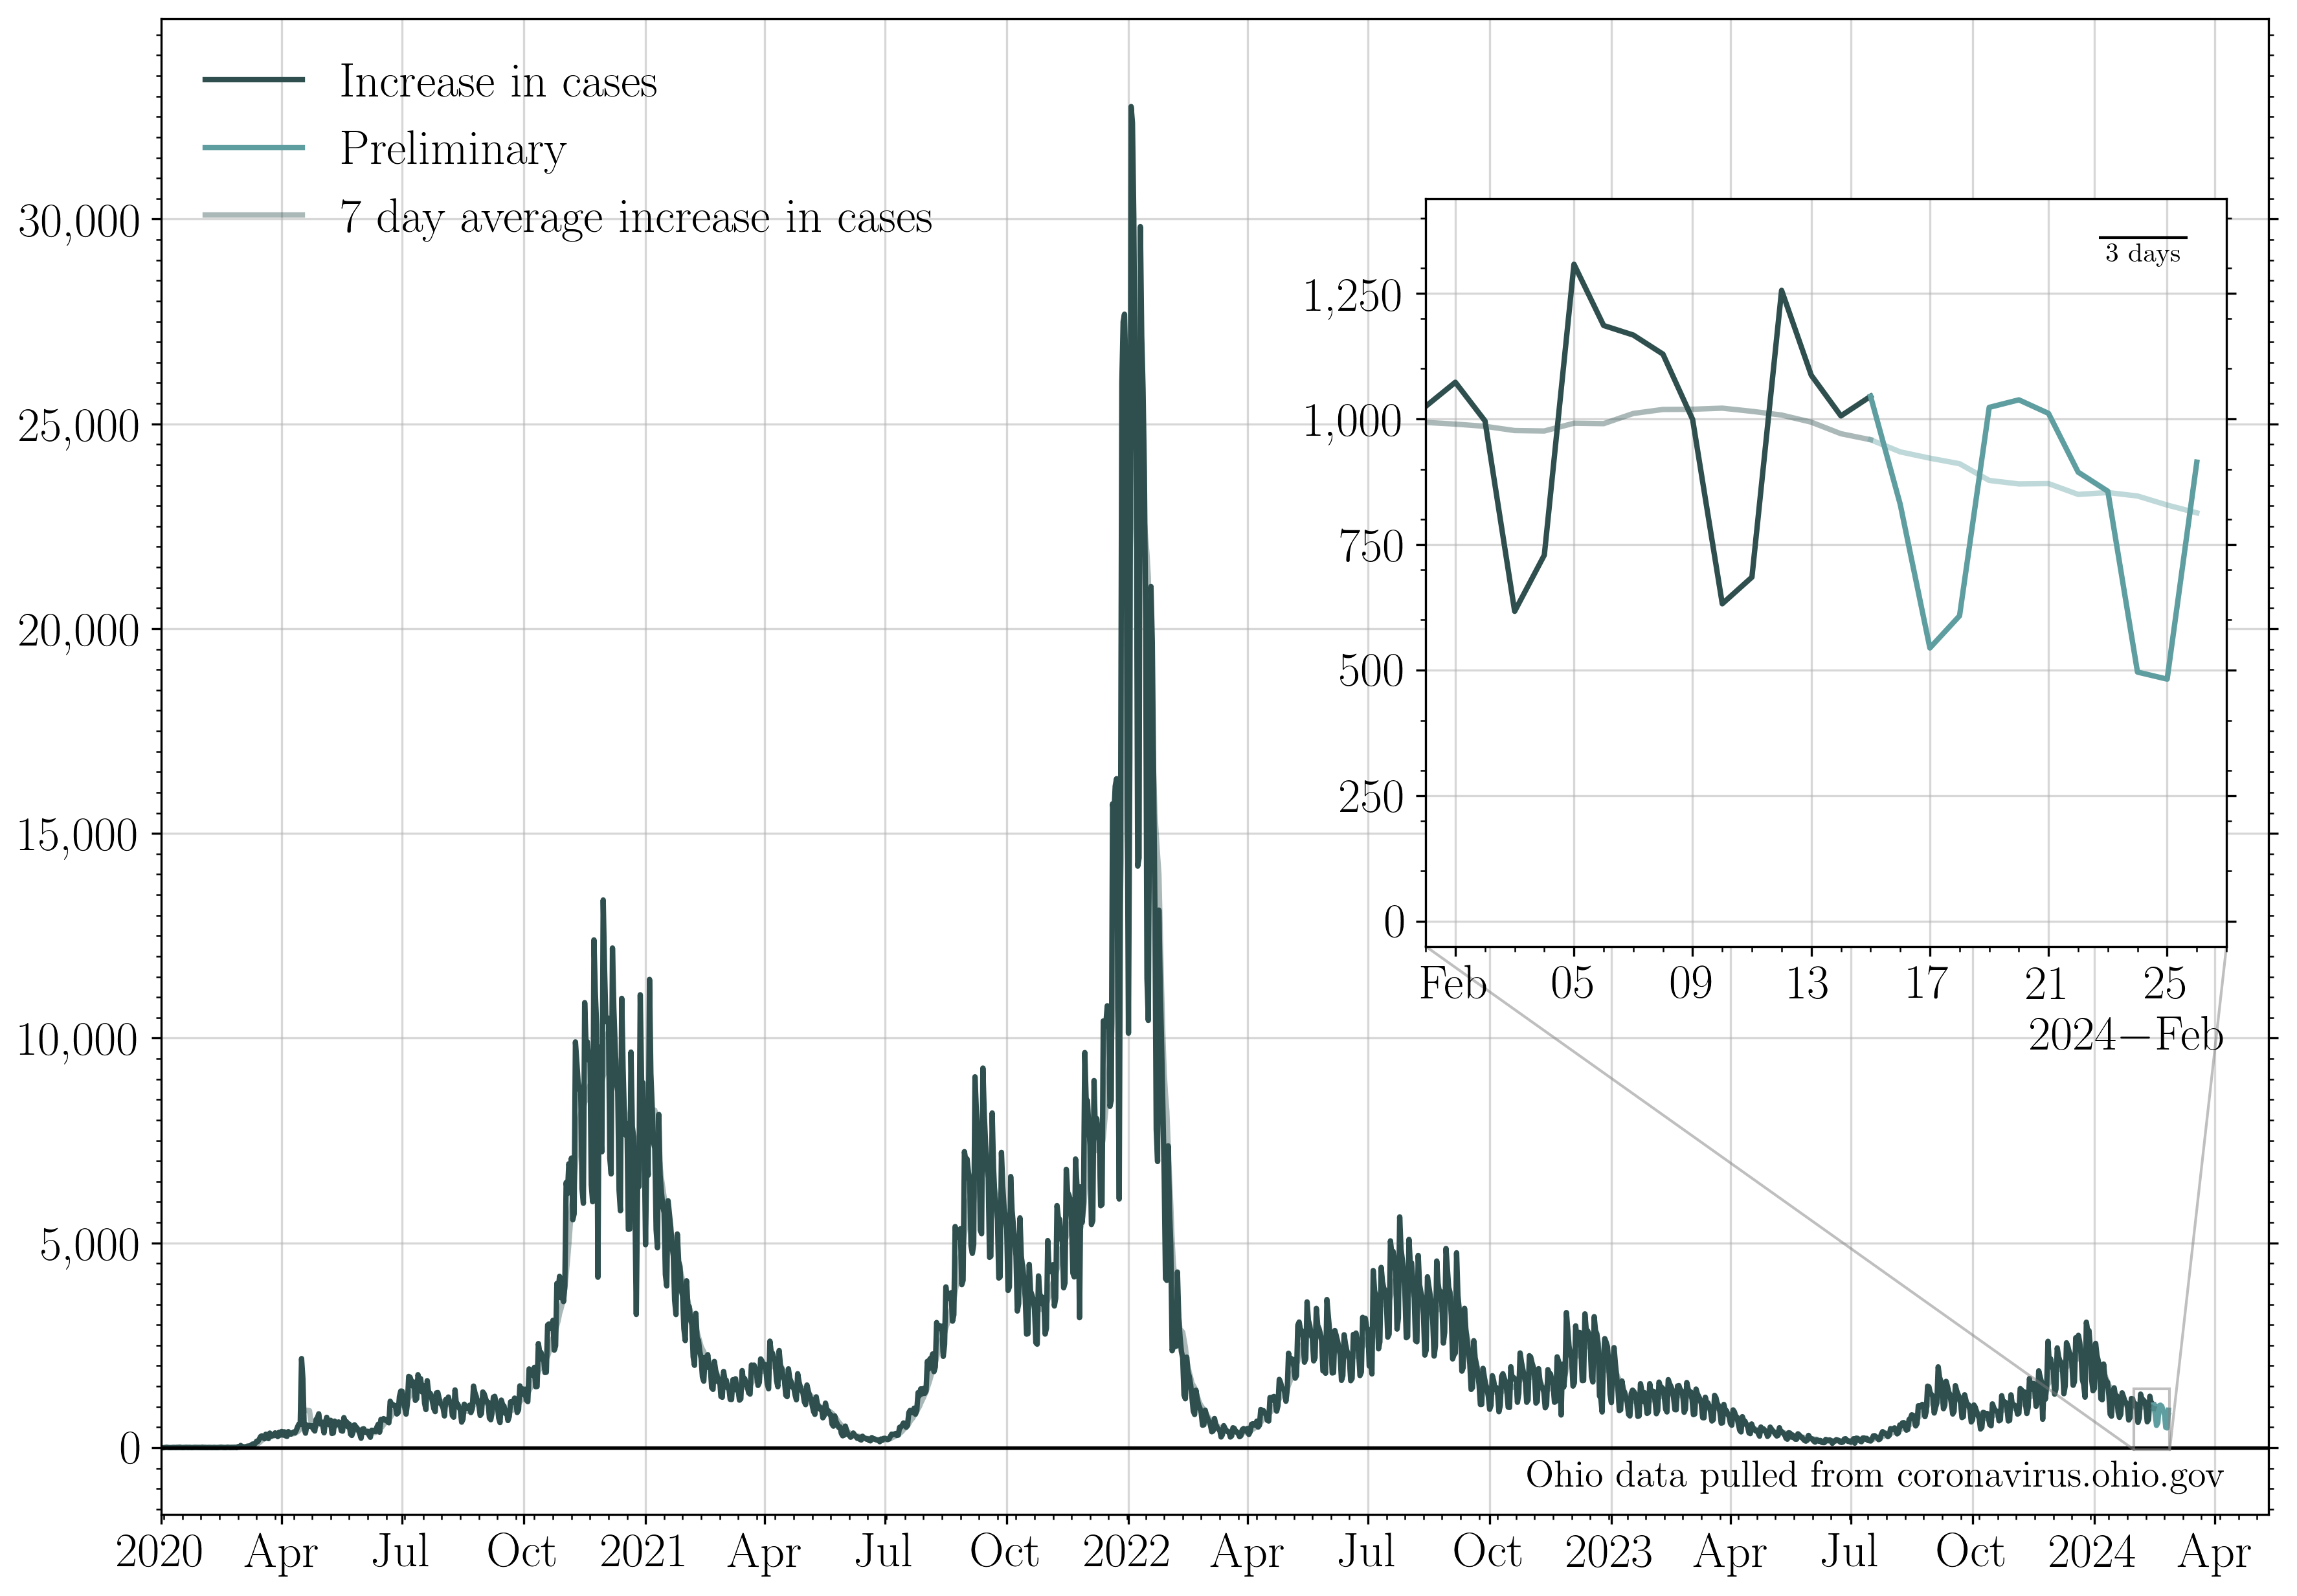
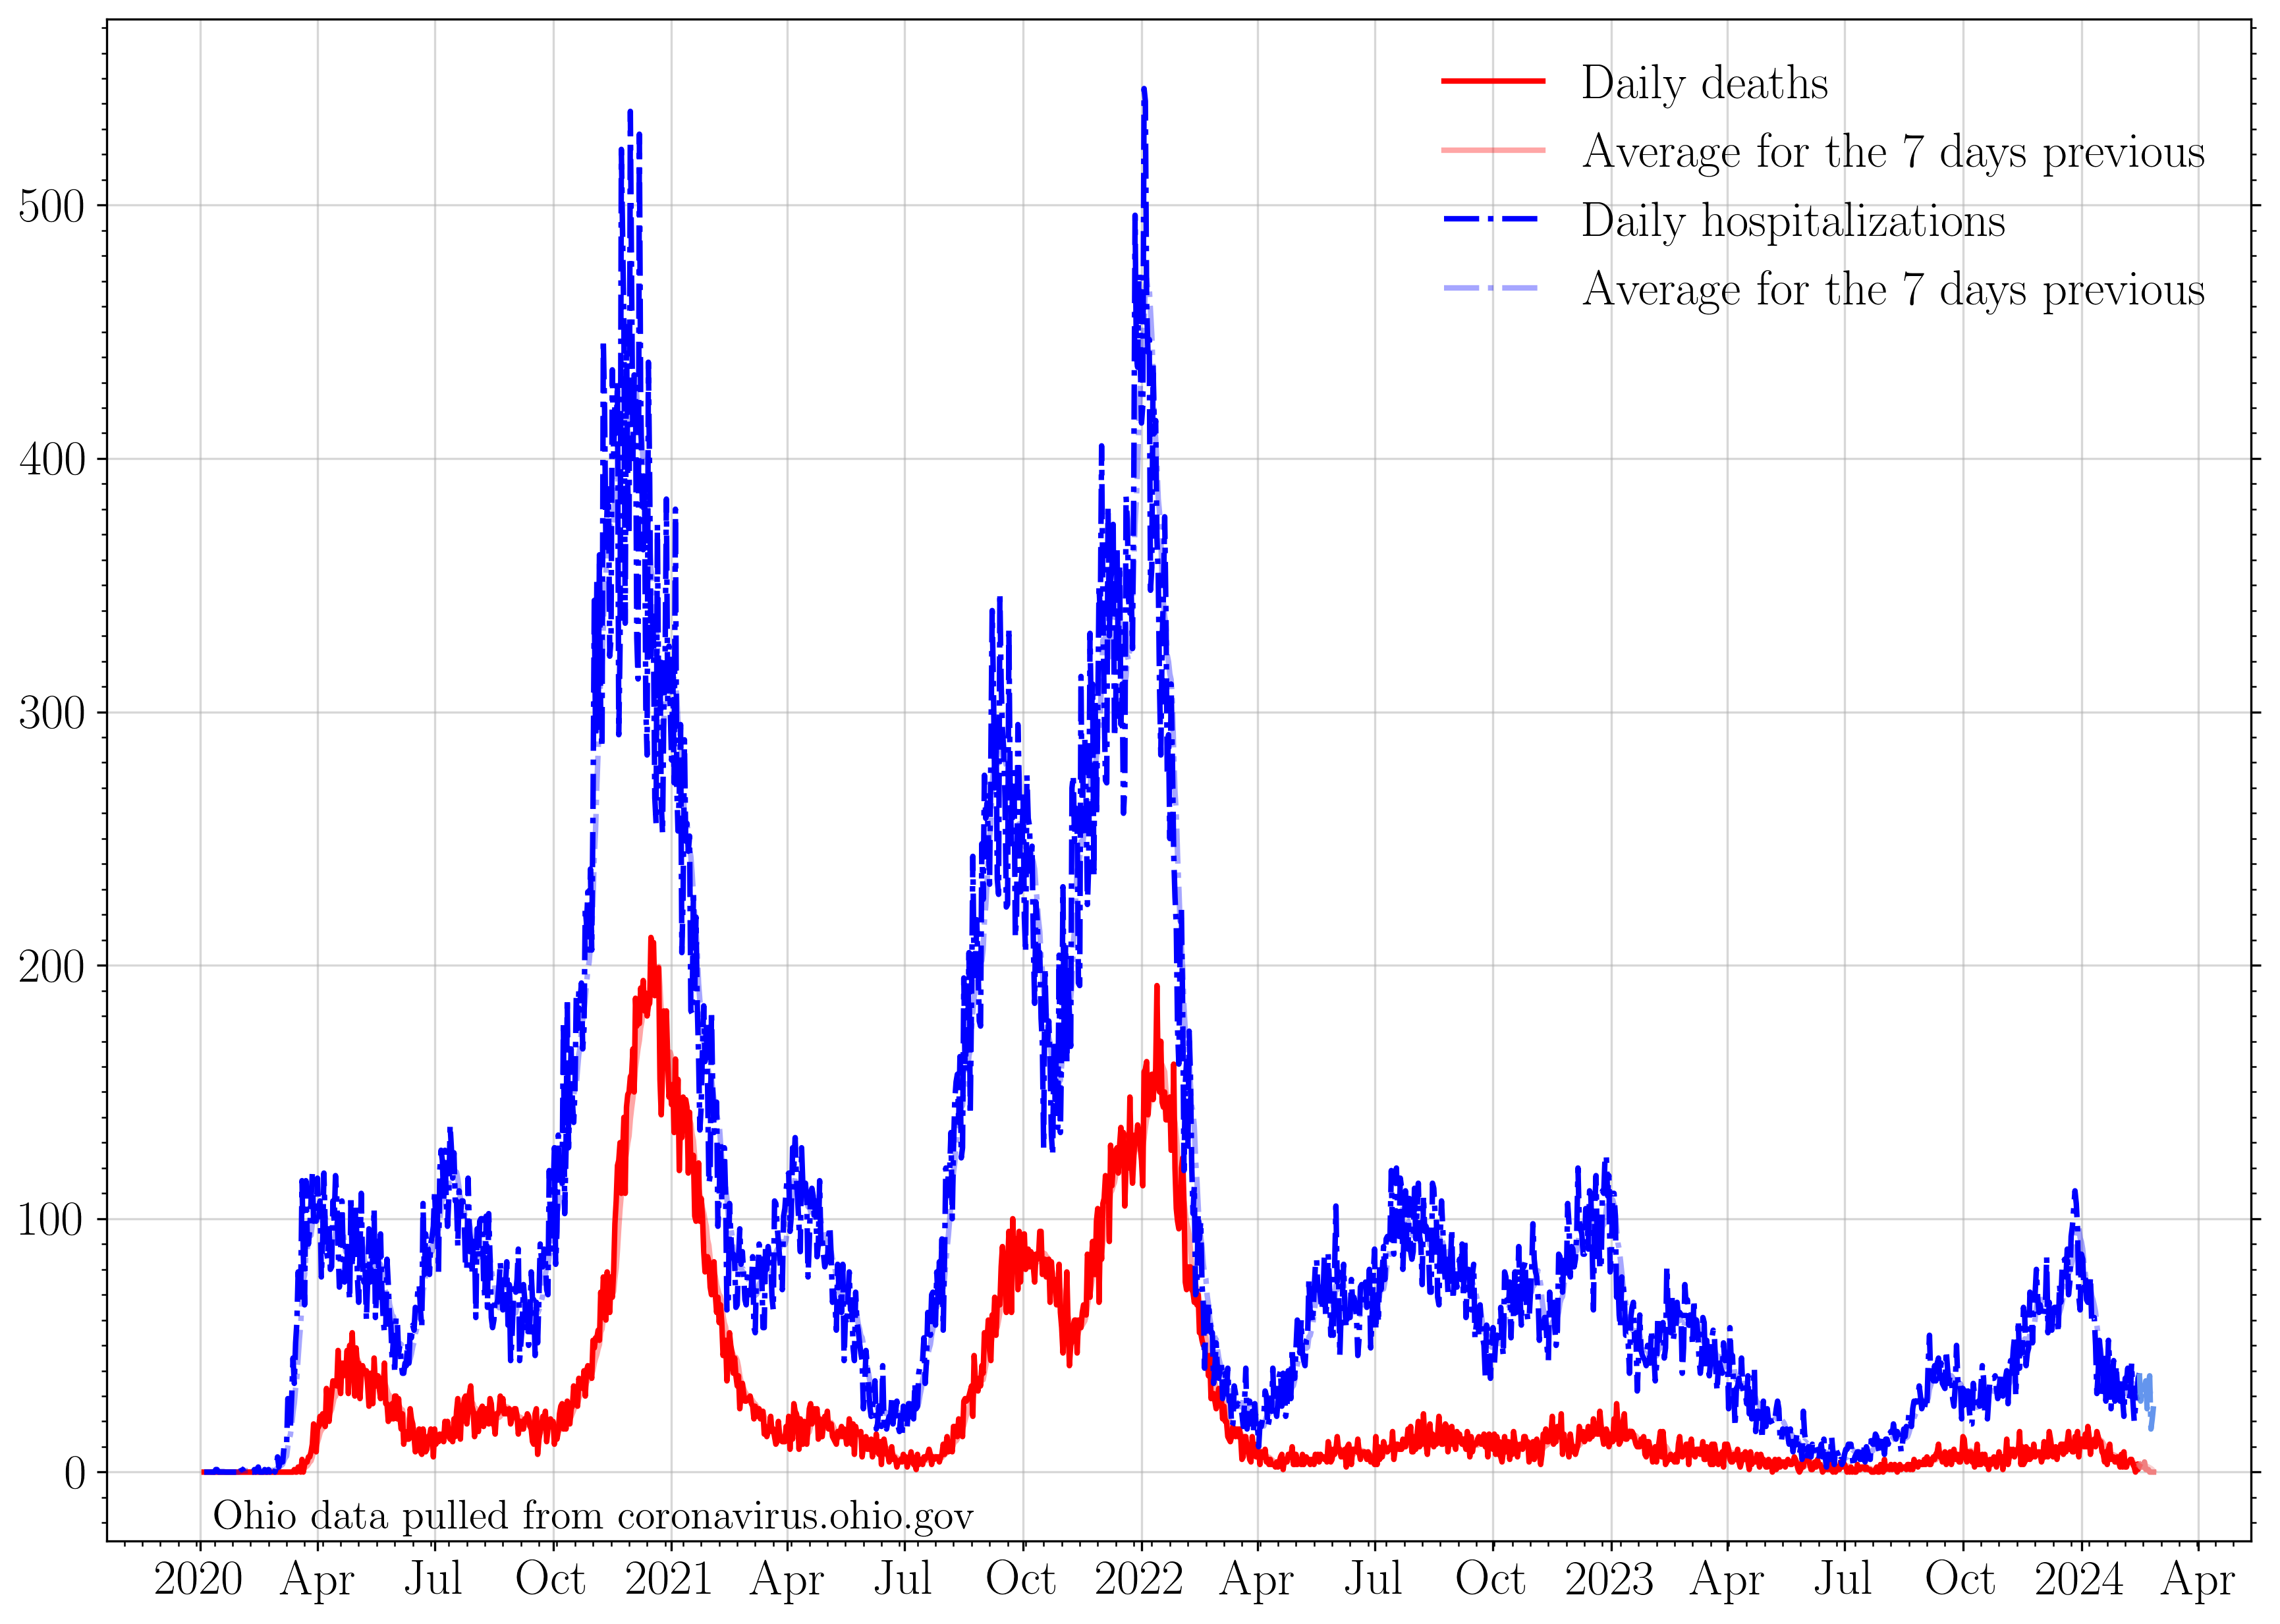
These figures cannot be updated as Ohio Dept. of Health is now only reporting case data by week and not the daily case data.
The raw daily increase in cases, hospitalizations, and deaths. The 7 day average is shown faintly behind the raw data. If no new cases were reported, this line would go to zero.
The raw daily increase in hospitalizations, ICU admissions, and deaths. The 7 day average is shown faintly behind the raw data. If no new events were reported, these lines would go to zero.
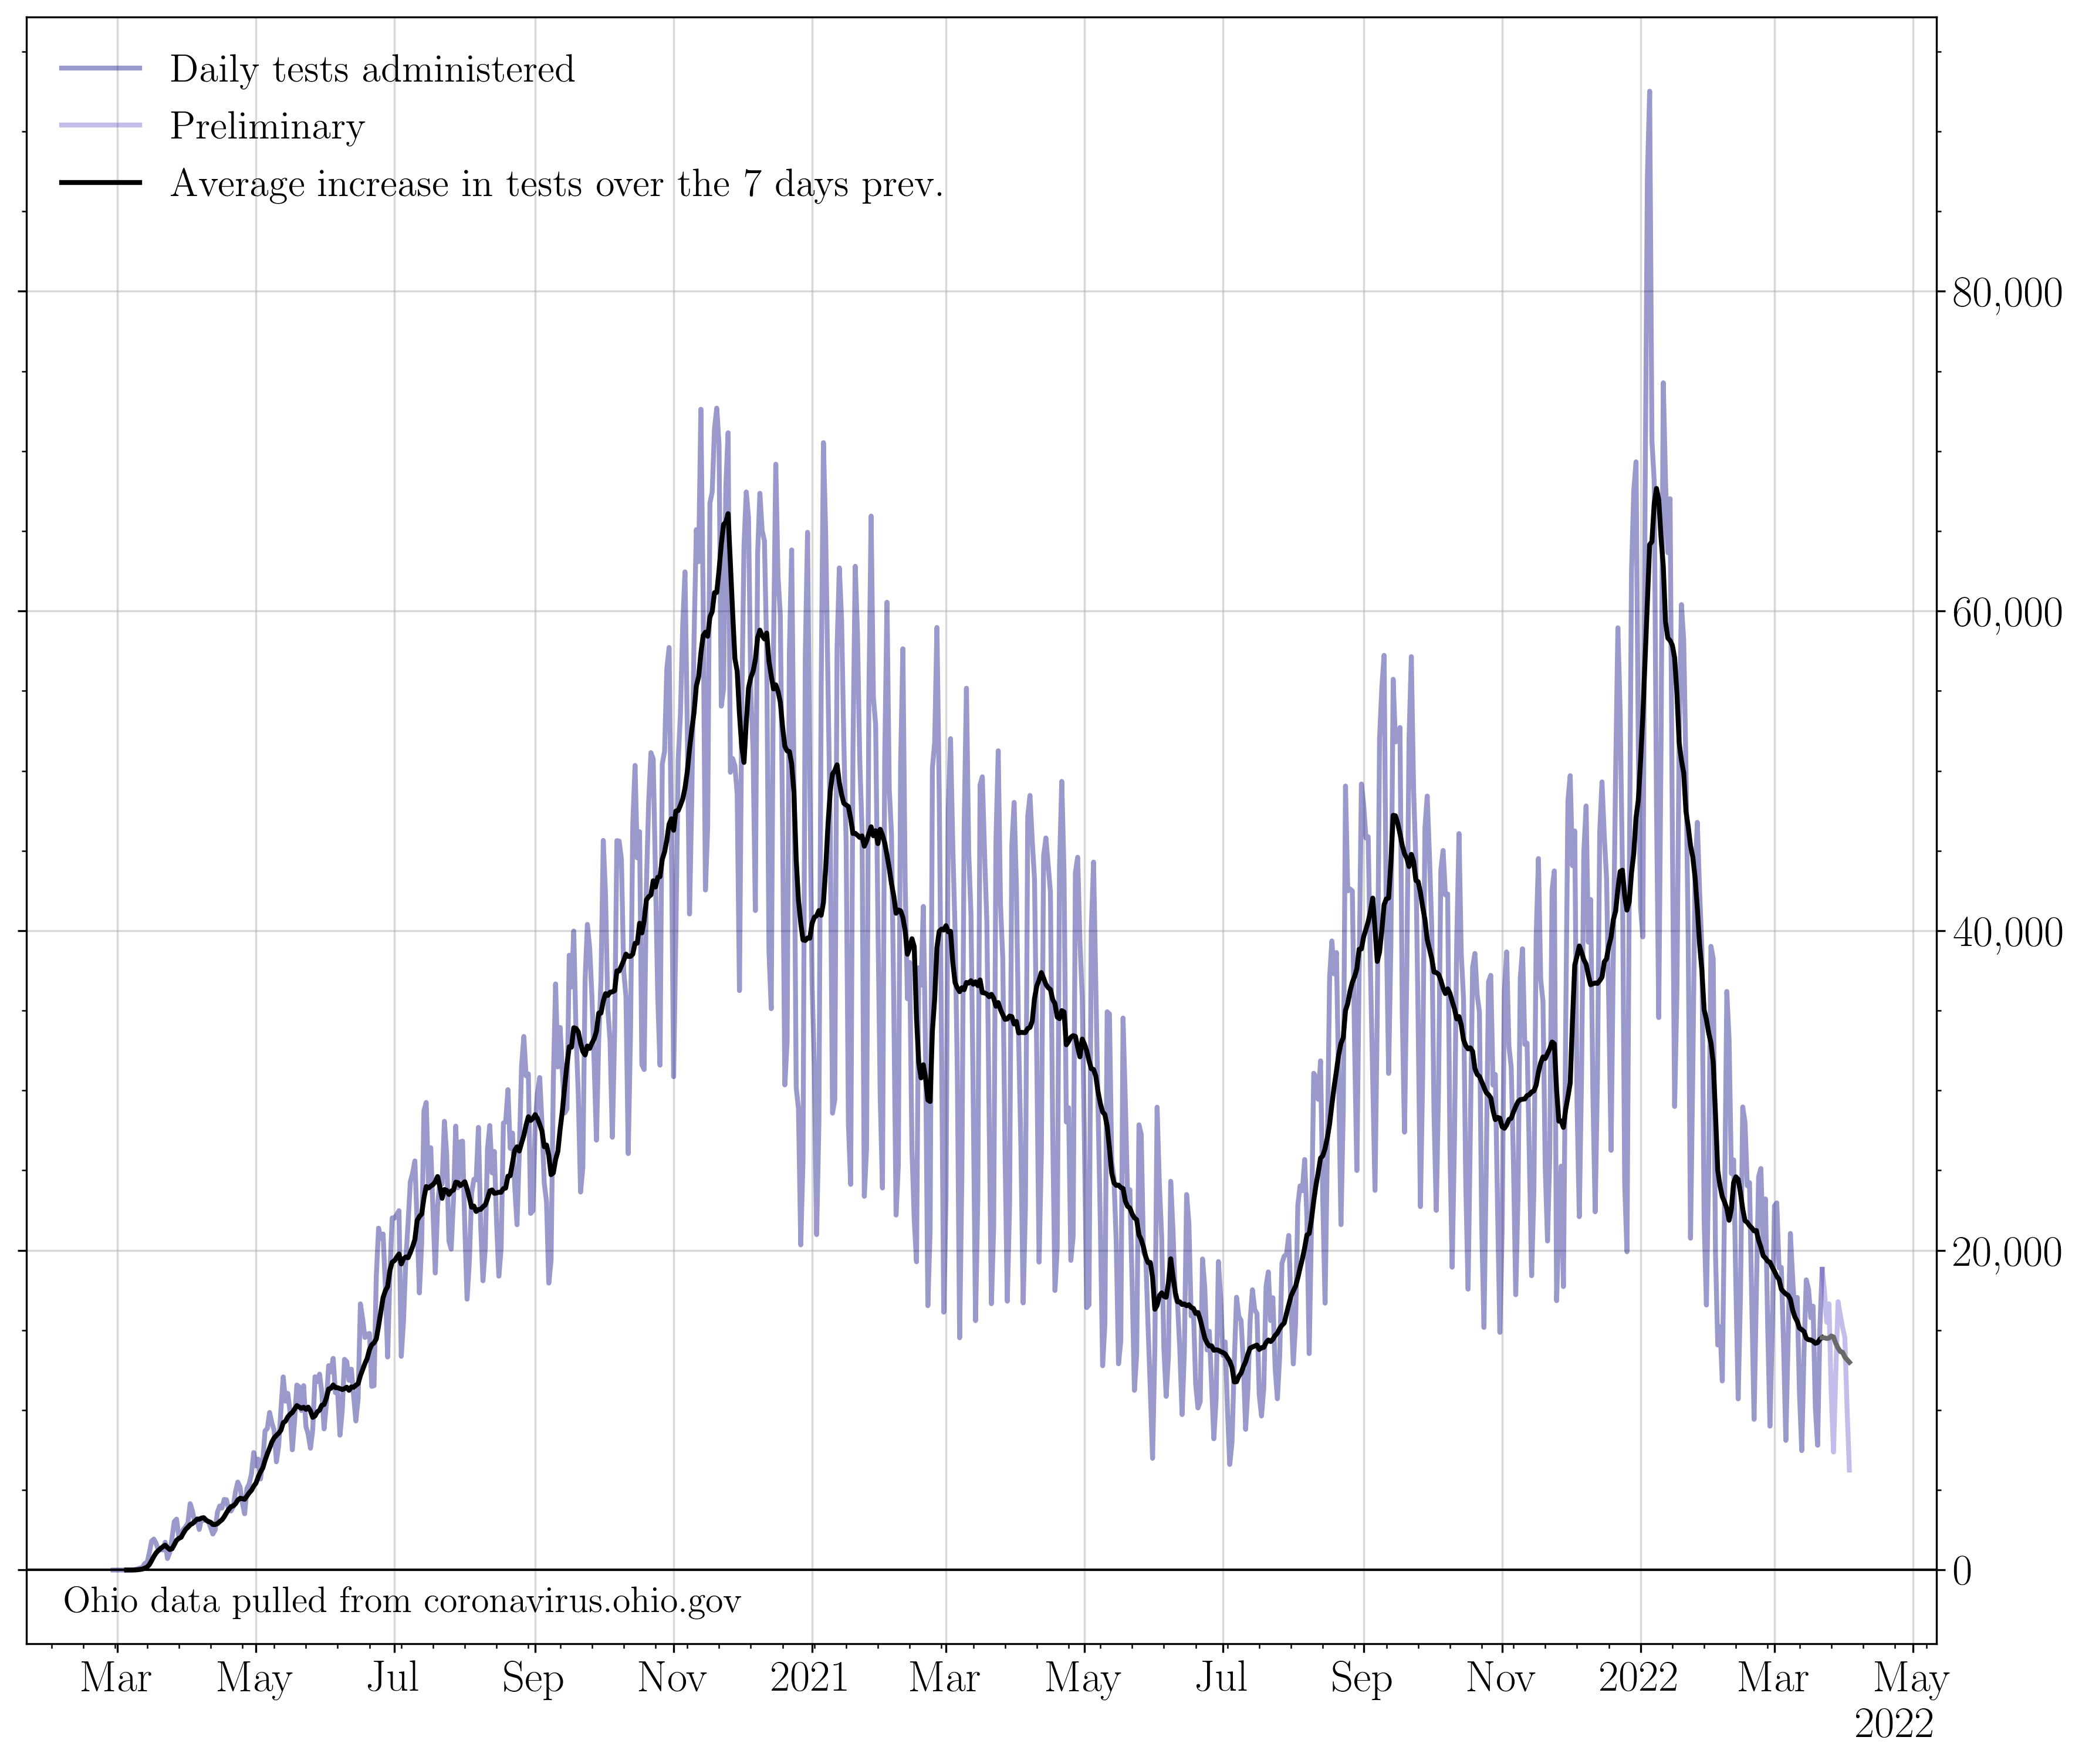
Archival: Testing
These figures cannot be updated as Ohio Dept. of Health is no longer reporting testing data.
The increase in the number of reported total tests (navy), ending April 4th, 2022. A 7 day running average is shown in black.
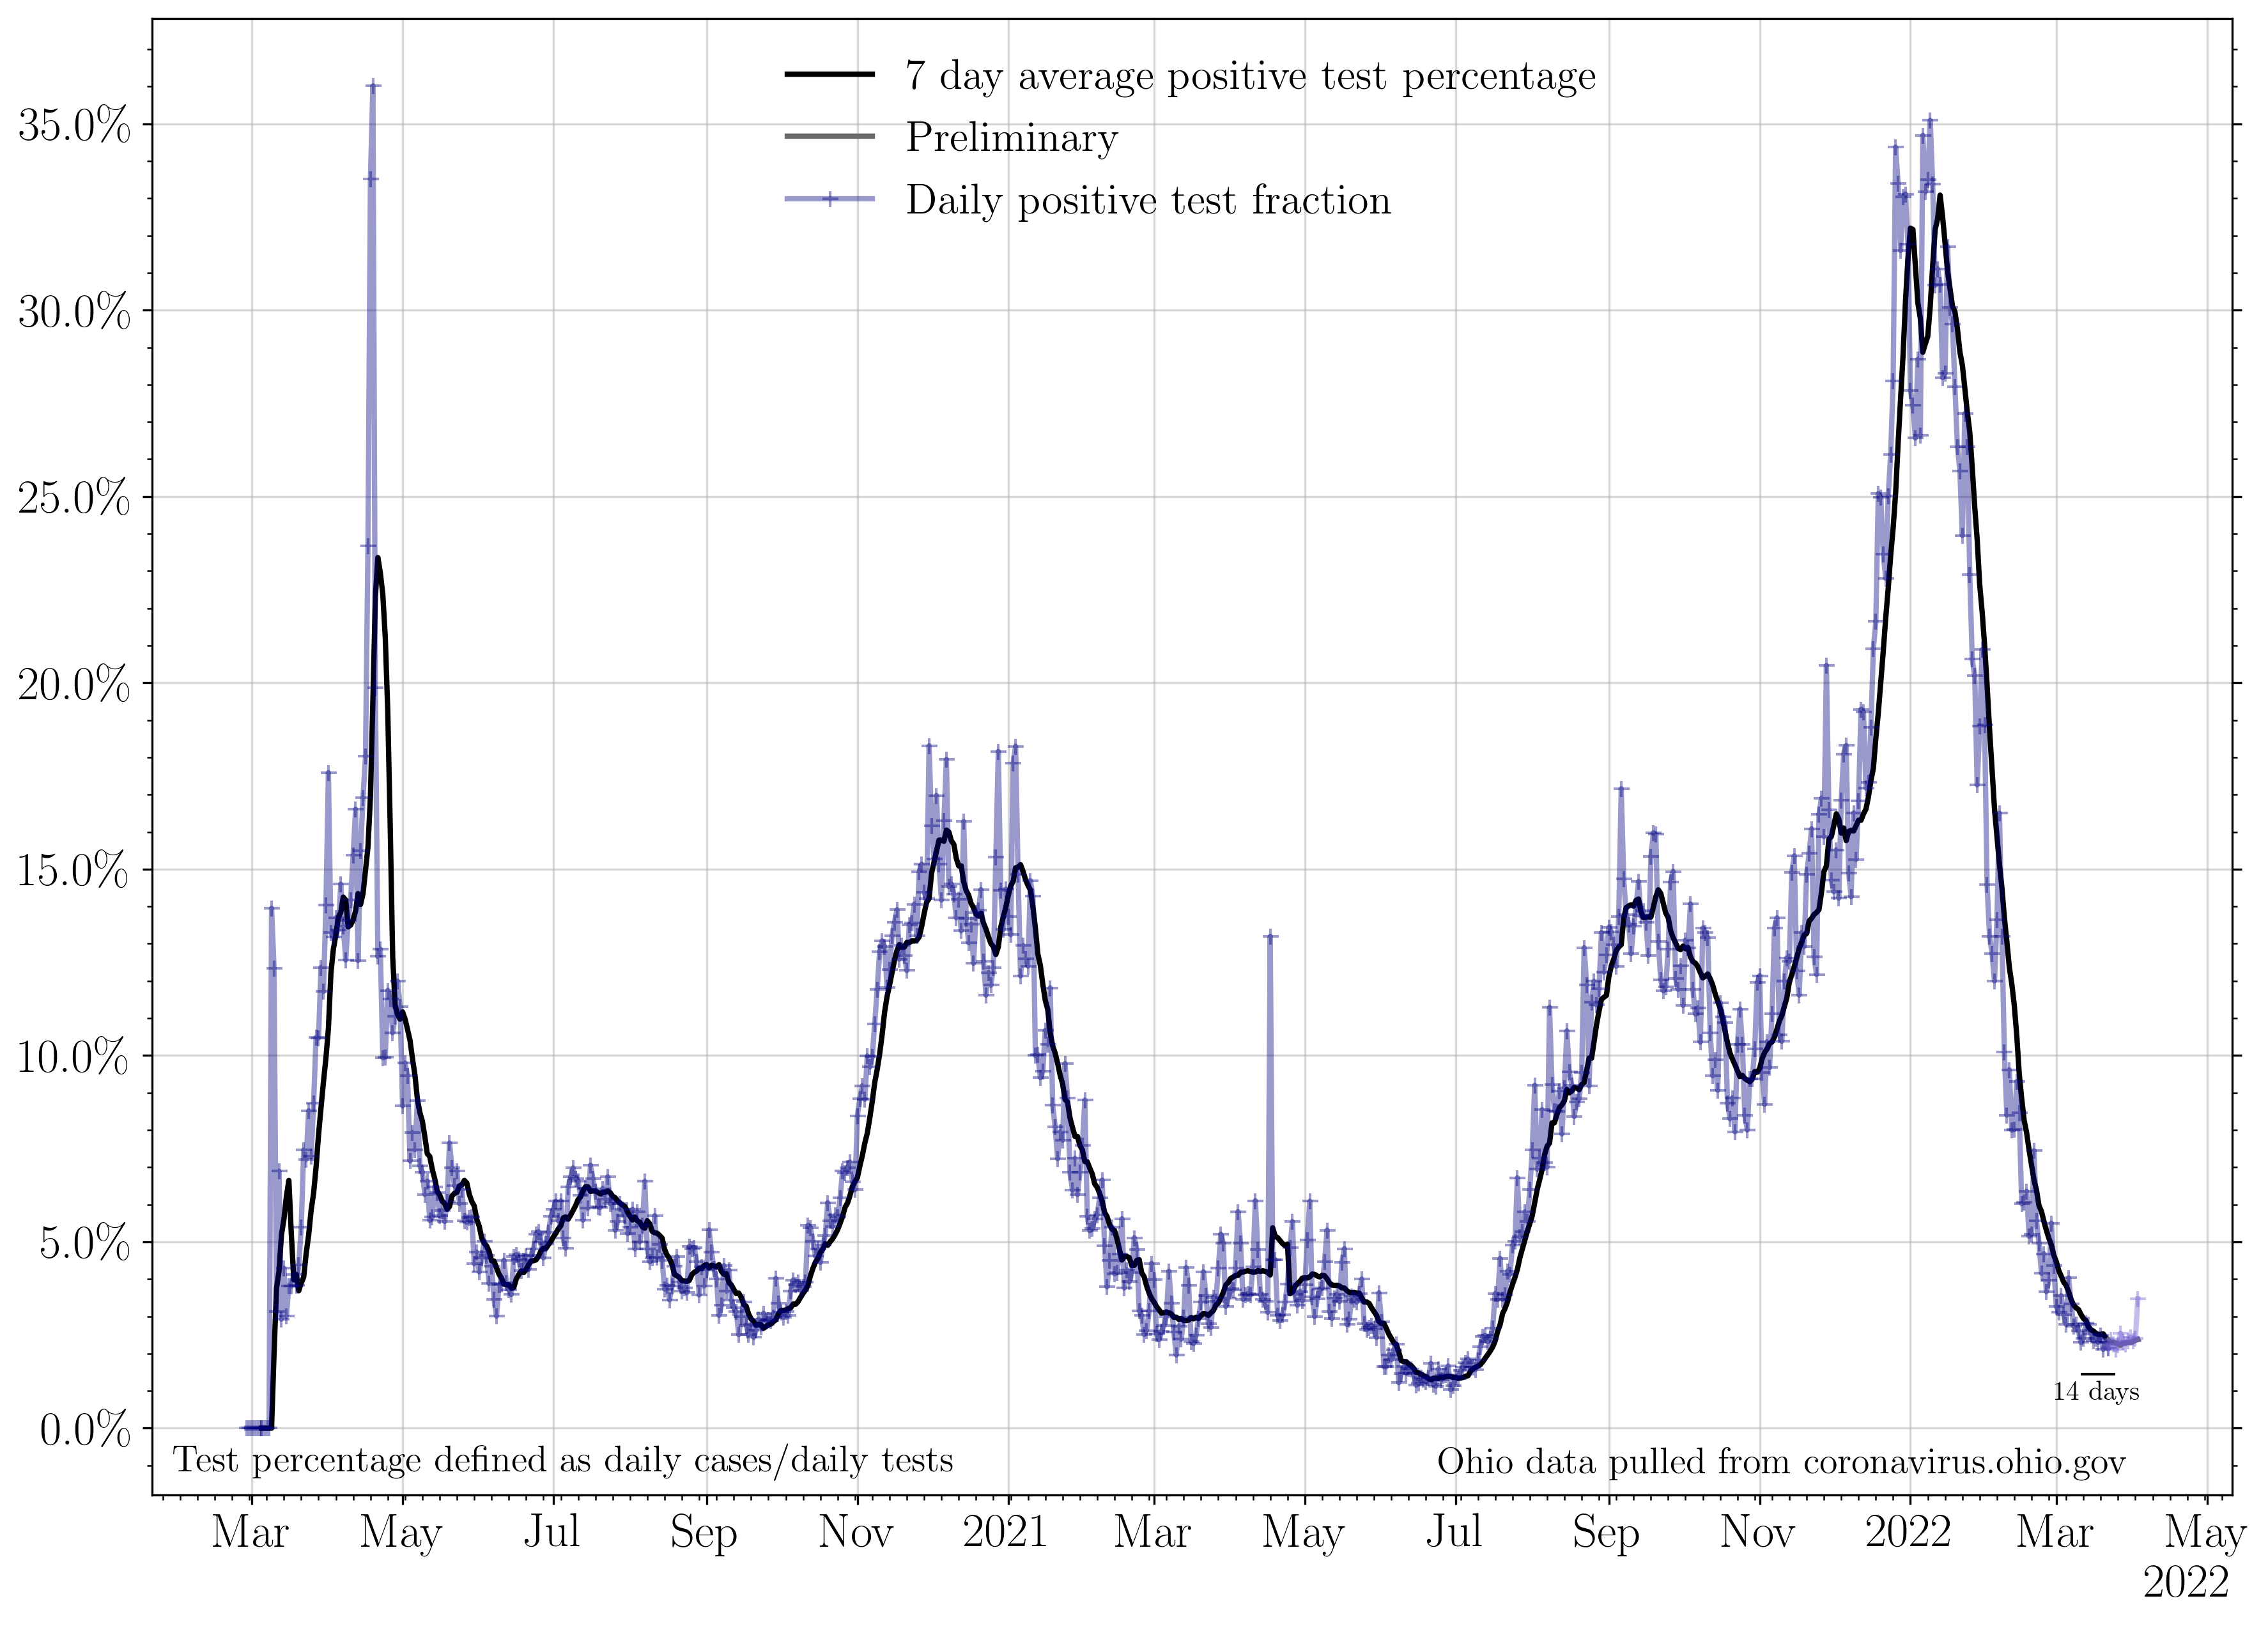
 The percent of each day’s new reported tests which represent that day’s new reported cases. Data ended on April 4th, 2022.